Spirit Airlines shares fell by -2.5% during the day's morning session, and are now trading at a price of $16.84. Is it time to buy the dip? To better answer that question, it's essential to check if the market is valuing the company's shares fairly in terms of its earnings and equity levels.
Spirit Airlines Has an Attractive P/B Ratio but a Worrisome P/E Ratio:
Spirit Airlines, Inc. provides airline services. The company provides front seats, including wider seats with extra legroom, carry-on and checked baggage, assigned seats, travel insurance, and onboard beverages and snacks, as well as hotels, cars, vacation packages, and cruises services. The company belongs to the Consumer Discretionary sector, which has an average price to earnings (P/E) ratio of 22.33 and an average price to book (P/B) ratio of 3.12. In contrast, Spirit Airlines has a trailing 12 month P/E ratio of -4.5 and a P/B ratio of 1.25.
When we divide Spirit Airlines's P/E ratio by its expected EPS growth rate of the next five years, we obtain its PEG ratio of -0.15. Since it's negative, the company has negative growth expectations, and most investors will probably avoid the stock unless it has an exceptionally low P/E and P/B ratio.
The Business Is Unprofitable and Its Balance Sheet Is Highly Leveraged:
| 2018-02-13 | 2019-02-13 | 2020-04-16 | 2021-02-10 | 2022-02-08 | 2023-02-06 | |
|---|---|---|---|---|---|---|
| Revenue (MM) | $2,644 | $3,323 | $3,831 | $1,810 | $3,231 | $5,068 |
| Gross Margins | 57.0% | 56.0% | 36.0% | -5.0% | 16.0% | 21.0% |
| Operating Margins | 15% | 14% | 18% | -40% | -9% | 1% |
| Net Margins | 16.0% | 5.0% | 9.0% | -24.0% | -15.0% | -11.0% |
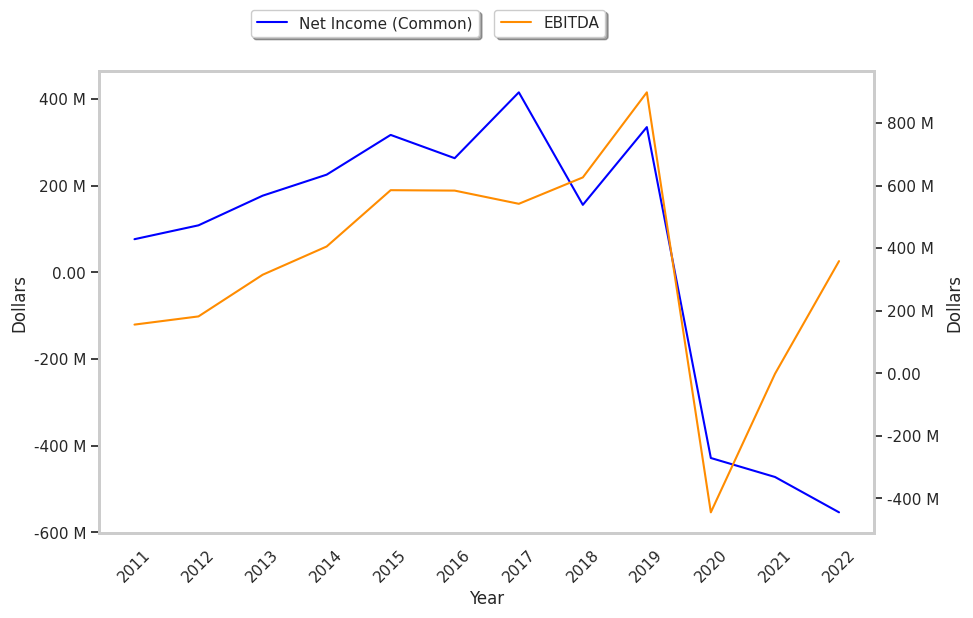
| Net Income (MM) | $416 | $156 | $335 | -$429 | -$473 | -$554 |
| Net Interest Expense (MM) | -$49 | -$65 | -$76 | -$128 | -$150 | -$120 |
| Depreciation & Amort. (MM) | -$140 | -$177 | -$225 | -$279 | -$297 | -$313 |
| Earnings Per Share | $5.99 | $2.28 | $4.89 | -$5.06 | -$4.5 | -$5.28 |
| EPS Growth | n/a | -61.94% | 114.47% | -203.48% | 11.07% | -17.33% |
| Diluted Shares (MM) | 69 | 68 | 69 | 85 | 105 | 105 |
| Free Cash Flow (MM) | $948 | $1,102 | $886 | $168 | $423 | $149 |
| Capital Expenditures (MM) | -$523 | -$596 | -$335 | -$393 | -$214 | -$238 |
| Net Current Assets (MM) | -$1,101 | -$1,891 | -$3,397 | -$3,793 | -$4,583 | -$5,619 |
| Long Term Debt (MM) | $1,387 | $2,025 | $1,960 | $4,315 | $4,727 | $5,656 |
| Net Debt / EBITDA | 1.11 | 1.73 | 1.26 | -6.61 | -2344.41 | 13.21 |
Spirit Airlines has consistently negative margins with a negative growth trend, declining EPS growth, and a highly leveraged balance sheet. On the other hand, the company has wider gross margins than its peer group working in its favor. Furthermore, Spirit Airlines has weak revenue growth and a flat capital expenditure trend, irregular cash flows, and just enough current assets to cover current liabilities.