We've been asking ourselves recently if the market has placed a fair valuation on Jones Lang LaSalle. Let's dive into some of the fundamental values of this mid-cap Finance company to determine if there might be an opportunity here for value-minded investors.
Trades Below Its Graham Number but Has an Elevated P/E Ratio:
Jones Lang LaSalle Incorporated, a professional services company, provides real estate and investment management services in Americas, Europe, the Middle East, Africa, and the Asia Pacific. The company belongs to the Finance sector, which has an average price to earnings (P/E) ratio of 14.34 and an average price to book (P/B) ratio of 1.57. In contrast, Jones Lang LaSalle has a trailing 12 month P/E ratio of 24.5 and a P/B ratio of 1.23.
Jones Lang LaSalle's PEG ratio is 1.92, which shows that the stock is probably overvalued in terms of its estimated growth. For reference, a PEG ratio near or below 1 is a potential signal that a company is undervalued.
The Business Runs With Low Leverage Levels:
| 2018-02-23 | 2019-02-26 | 2020-02-27 | 2021-02-18 | 2022-02-28 | 2023-02-28 | |
|---|---|---|---|---|---|---|
| Revenue (MM) | $7,932 | $16,318 | $17,983 | $16,590 | $19,367 | $20,862 |
| Interest Income (MM) | -$56 | -$51 | -$56 | -$53 | -$40 | -$75 |
| Operating Margins | 7% | 5% | 5% | 4% | 6% | 5% |
| Net Margins | 3.0% | 3.0% | 3.0% | 2.0% | 5.0% | 3.0% |
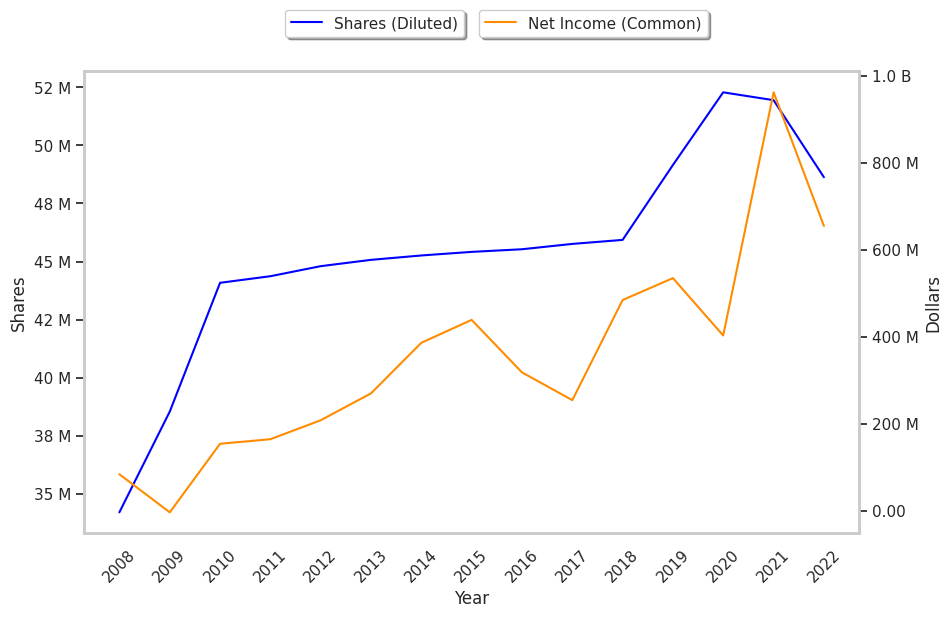
| Net Income (MM) | $254 | $484 | $535 | $402 | $962 | $654 |
| Depreciation & Amort. (MM) | -$167 | -$186 | -$202 | -$226 | -$218 | -$228 |
| Earnings Per Share | $5.55 | $10.54 | $10.87 | $7.7 | $18.51 | $13.46 |
| EPS Growth | n/a | 89.91% | 3.13% | -29.16% | 140.39% | -27.28% |
| Diluted Shares (MM) | 46 | 46 | 49 | 52 | 52 | 49 |
| Free Cash Flow (MM) | $792 | $714 | $672 | $1,264 | $1,148 | $406 |
| Capital Expenditures (MM) | -$2 | -$110 | -$188 | -$149 | -$176 | -$206 |
| Net Current Assets (MM) | -$1,331 | -$1,085 | -$2,591 | -$2,245 | -$2,696 | -$2,874 |
| Long Term Debt (MM) | $675 | $656 | $1,177 | $693 | $534 | $1,587 |
| Net Debt / EBITDA | 0.66 | 0.22 | 0.77 | 0.2 | 0.38 | 1.16 |
Jones Lang LaSalle has weak revenue growth and a flat capital expenditure trend, weak operating margings with a negative growth trend, and irregular cash flows. In addition, we note just enough current assets to cover current liabilities. We also note that the company benefits from low leverage and positive EPS growth. Furthermore, Jones Lang LaSalle's financial statements do not display any obvious red flags.