It's been a great afternoon session for Kraft Heinz investors, who saw their shares rise 1.7% to a price of $33.76 per share. At these higher prices, is the company still fairly valued? If you are thinking about investing, make sure to check the company's fundamentals before making a decision.
Kraft Heinz Has Attractive Multiples and Trades Below Its Graham Number:
The Kraft Heinz Company, together with its subsidiaries, manufactures and markets food and beverage products in the United States, Canada, the United Kingdom, and internationally. The company belongs to the Consumer Staples sector, which has an average price to earnings (P/E) ratio of 24.36 and an average price to book (P/B) ratio of 4.29. In contrast, Kraft Heinz has a trailing 12 month P/E ratio of 13.2 and a P/B ratio of 0.83.
Kraft Heinz's PEG ratio is 2.24, which shows that the stock is probably overvalued in terms of its estimated growth. For reference, a PEG ratio near or below 1 is a potential signal that a company is undervalued.
Exceptional Profitability Overshadowed by Excessive Leverage:
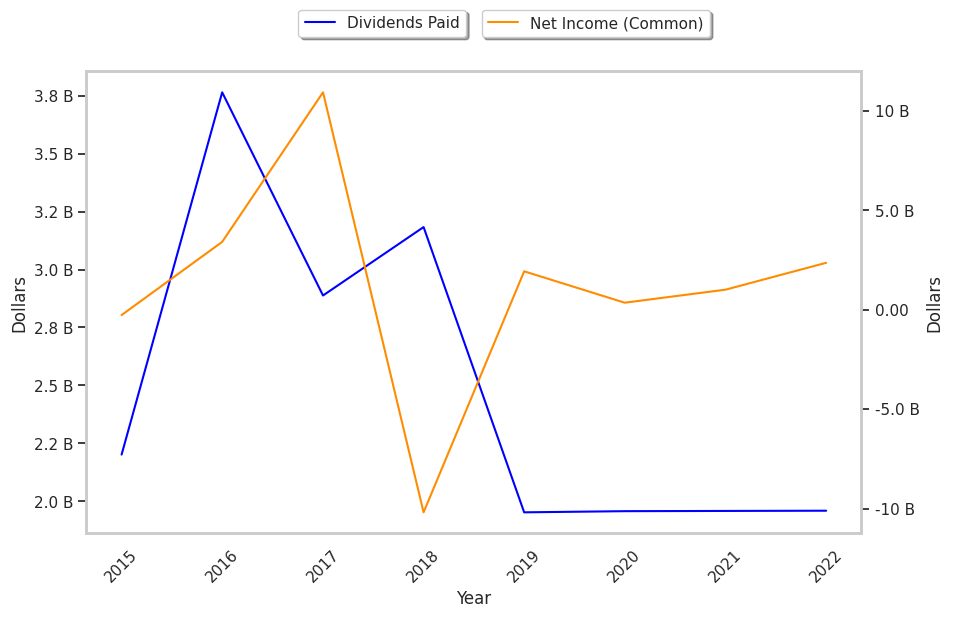
| 2018-02-16 | 2019-06-07 | 2020-02-14 | 2021-02-17 | 2022-02-17 | 2023-02-16 | |
|---|---|---|---|---|---|---|
| Revenue (MM) | $26,076 | $26,268 | $24,977 | $26,185 | $26,042 | $26,485 |
| Gross Margins | 35.0% | 34.0% | 33.0% | 35.0% | 33.0% | 31.0% |
| Operating Margins | 23% | 22% | 20% | 21% | 20% | 17% |
| Net Margins | 42.0% | -39.0% | 8.0% | 1.0% | 4.0% | 9.0% |
| Net Income (MM) | $10,941 | -$10,192 | $1,935 | $356 | $1,012 | $2,363 |
| Net Interest Expense (MM) | -$1,234 | -$1,284 | -$1,361 | -$1,394 | -$2,047 | -$921 |
| Depreciation & Amort. (MM) | -$1,031 | -$983 | -$994 | -$969 | -$910 | -$933 |
| Earnings Per Share | $8.91 | -$8.36 | $1.58 | $0.29 | $0.82 | $1.91 |
| EPS Growth | n/a | -193.83% | 118.9% | -81.65% | 182.76% | 132.93% |
| Diluted Shares (MM) | 1,228 | 1,219 | 1,224 | 1,228 | 1,236 | 1,236 |
| Free Cash Flow (MM) | $1,695 | $3,400 | $4,320 | $5,525 | $6,269 | $3,385 |
| Capital Expenditures (MM) | -$1,194 | -$826 | -$768 | -$596 | -$905 | -$916 |
| Net Current Assets (MM) | -$46,815 | -$42,608 | -$41,604 | -$38,765 | -$34,948 | -$33,746 |
| Long Term Debt (MM) | $28,308 | $30,770 | $28,216 | $28,070 | $21,061 | $19,233 |
| Net Debt / EBITDA | 4.19 | 4.47 | 4.52 | 3.83 | 3.06 | 3.47 |