Now trading at a price of $102.78, 3M Company has moved 1.7% so far today.
3M Company returned losses of -9.0% last year, with its stock price reaching a high of $133.91 and a low of $92.38. Over the same period, the stock underperformed the S&P 500 index by -26.0%. As of April 2023, the company's 50-day average price was $104.02. 3M Company provides diversified technology services in the United States and internationally. Based in Saint Paul, MN, the large-cap Health Care company has 92,000 full time employees. 3M Company has offered a 5.9% dividend yield over the last 12 months.
Shareholders Are Confronted With a Declining EPS Growth Trend:
| 2018-02-08 | 2019-02-07 | 2020-02-06 | 2021-02-04 | 2022-02-09 | 2023-02-08 | |
|---|---|---|---|---|---|---|
| Revenue (MM) | $31,657 | $32,765 | $32,136 | $32,184 | $35,355 | $34,229 |
| Gross Margins | 49.0% | 49.0% | 47.0% | 48.0% | 47.0% | 44.0% |
| Operating Margins | 22% | 20% | 19% | 21% | 21% | 12% |
| Net Margins | 15.0% | 16.0% | 14.0% | 17.0% | 17.0% | 17.0% |
| Net Income (MM) | $4,858 | $5,349 | $4,517 | $5,449 | $5,921 | $5,777 |
| Earnings Per Share | $7.93 | $8.89 | $7.72 | $9.36 | $10.1 | $10.18 |
| EPS Growth | n/a | 12.11% | -13.16% | 21.24% | 7.91% | 0.79% |
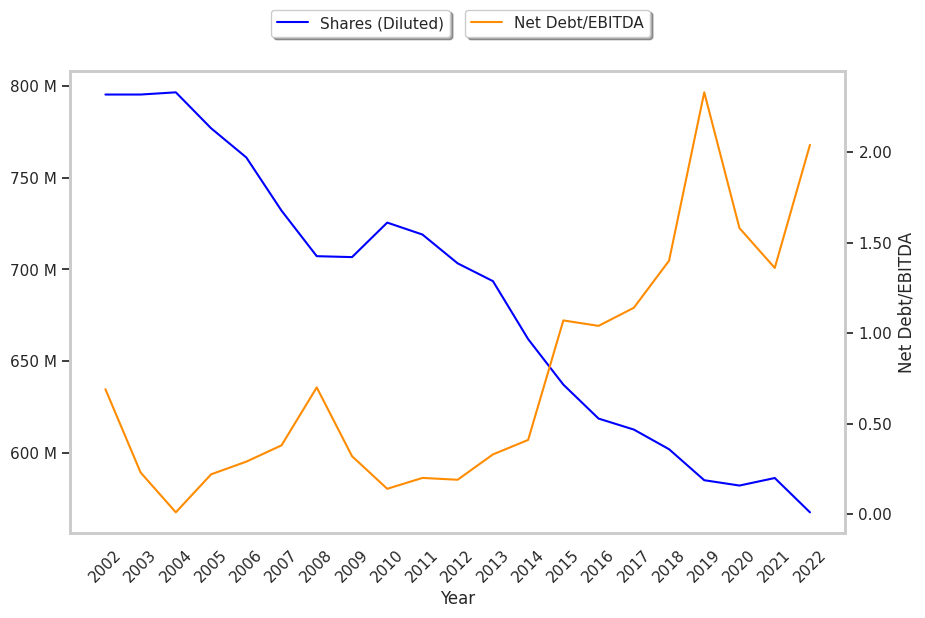
| Diluted Shares (MM) | 613 | 602 | 585 | 582 | 586 | 568 |
| Free Cash Flow (MM) | $7,564 | $7,754 | $8,646 | $9,486 | $9,006 | $7,140 |
| Capital Expenditures (MM) | -$1,324 | -$1,315 | -$1,576 | -$1,373 | -$1,552 | -$1,549 |
| Net Current Assets (MM) | -$12,088 | -$12,943 | -$21,562 | -$19,431 | -$16,552 | -$16,997 |
| Long Term Debt (MM) | $12,096 | $13,411 | $17,518 | $17,989 | $16,056 | $14,001 |
| Net Debt / EBITDA | 1.14 | 1.4 | 2.33 | 1.58 | 1.36 | 2.04 |
3M Company has weak revenue growth and a flat capital expenditure trend, irregular cash flows, and just enough current assets to cover current liabilities. We also note that the company benefits from strong margins with a negative growth trend and healthy leverage. However, the firm suffers from slimmer gross margins than its peers and declining EPS growth.
3M Company does not have a meaningful trailing P/E ratio since its earnings per share are currently in the red. Based on its EPS guidance of $9.71, the company has a forward P/E ratio of 10.7. In comparison, the average P/E ratio for the Health Care sector is 24.45. Furthermore, 3M Company is likely overvalued compared to the book value of its equity, since its P/B ratio of 7.28 is higher than the sector average of 4.16.
3M Company Has an Analyst Consensus of Some Upside Potential:
The 13 analysts following 3M Company have set target prices ranging from $96.0 to $120.0 per share, for an average of $113.69 with a hold rating. As of April 2023, the company is trading -8.5% away from its average target price, indicating that there is an analyst consensus of some upside potential.
3M Company has an average amount of shares sold short because 2.2% of the company's shares are sold short. Institutions own 67.4% of the company's shares, and the insider ownership rate stands at 0.12%, suggesting a small amount of insider investors. The largest shareholder is Vanguard Group Inc, whose 9% stake in the company is worth $5,007,294,384.