We've been asking ourselves recently if the market has placed a fair valuation on Apple. Let's dive into some of the fundamental values of this large-cap Technology company to determine if there might be an opportunity here for value-minded investors.
Apple's Valuation Is in Line With Its Sector Averages:
Apple Inc. designs, manufactures, and markets smartphones, personal computers, tablets, wearables, and accessories worldwide. The company belongs to the Technology sector, which has an average price to earnings (P/E) ratio of 27.16 and an average price to book (P/B) ratio of 6.23. In contrast, Apple has a trailing 12 month P/E ratio of 29.3 and a P/B ratio of 45.37.
Apple's PEG ratio is 5.24, which shows that the stock is probably overvalued in terms of its estimated growth. For reference, a PEG ratio near or below 1 is a potential signal that a company is undervalued.
The Business Has Operating Margins Consistently Higher Than the 21.41% industry Average:
| 2017-11-03 | 2018-11-05 | 2019-10-31 | 2020-10-30 | 2021-10-29 | 2022-10-28 | |
|---|---|---|---|---|---|---|
| Revenue (MM) | $229,234 | $265,595 | $260,174 | $274,515 | $365,817 | $394,328 |
| Gross Margins | 38.0% | 38.0% | 38.0% | 38.0% | 42.0% | 43.0% |
| Operating Margins | 27% | 27% | 25% | 24% | 30% | 30% |
| Net Margins | 21.0% | 22.0% | 21.0% | 21.0% | 26.0% | 25.0% |
| Net Income (MM) | $48,351 | $59,531 | $55,256 | $57,411 | $94,680 | $99,803 |
| Earnings Per Share | $2.3 | $2.98 | $2.97 | $3.28 | $5.73 | $6.11 |
| EPS Growth | n/a | 29.57% | -0.34% | 10.44% | 74.7% | 6.63% |
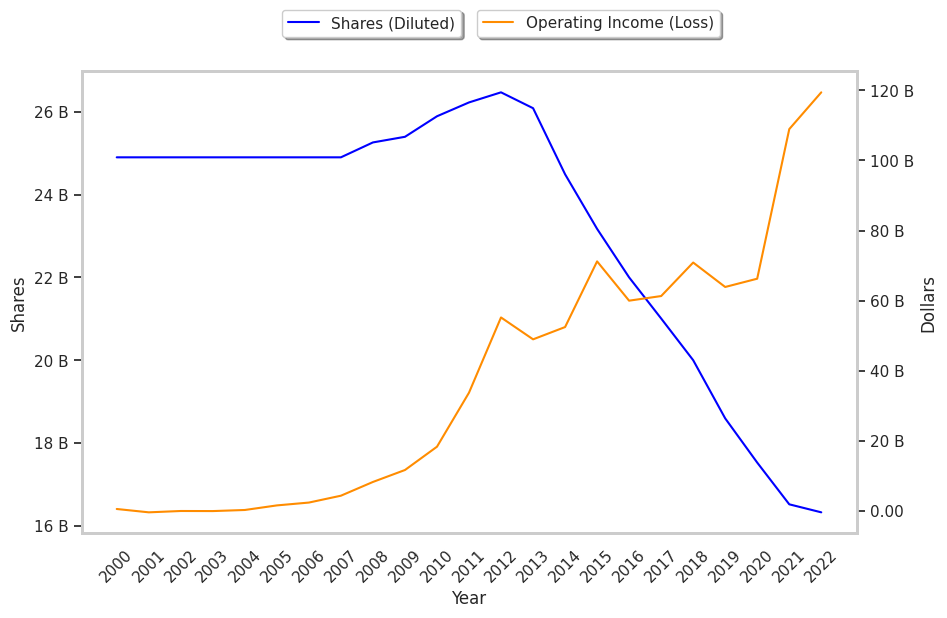
| Diluted Shares (MM) | 21,007 | 20,000 | 18,596 | 17,528 | 16,519 | 16,326 |
| Free Cash Flow (MM) | $76,676 | $90,747 | $79,886 | $87,983 | $115,123 | $132,859 |
| Capital Expenditures (MM) | -$12,451 | -$13,313 | -$10,495 | -$7,309 | -$11,085 | -$10,708 |
| Net Current Assets (MM) | -$112,627 | -$127,239 | -$85,209 | -$114,836 | -$153,076 | -$166,678 |
| Long Term Debt (MM) | $97,207 | $93,735 | $91,807 | $98,667 | $118,719 | $110,087 |
| Net Debt / EBITDA | 0.58 | 0.59 | 0.1 | 0.28 | 0.52 | 0.55 |
Apple has strong margins with a stable trend and a pattern of improving cash flows. Additionally, the company's financial statements display low leverage and a strong EPS growth trend. However, the firm has slimmer gross margins than its peers. Finally, we note that Apple has weak revenue growth and a flat capital expenditure trend.