Standing out among the Street's worst performers today is DexCom, a medical instruments & supplies company whose shares slumped -4.1% to a price of $97.36, 34.02% below its average analyst target price of $147.56.
The average analyst rating for the stock is buy. DXCM lagged the S&P 500 index by -3.0% so far today and by -8.0% over the last year, returning 8.0%.
DexCom, Inc., a medical device company, focuses on the design, development, and commercialization of continuous glucose monitoring (CGM) systems in the United States and internationally. The company is categorized within the healthcare sector. The catalysts that drive valuations in this sector are complex. From demographics, regulations, scientific breakthroughs, to the emergence of new diseases, healthcare companies see their prices swing on the basis of a variety of factors.
DexCom's trailing 12 month P/E ratio is 117.3, based on its trailing EPS of $0.83. The company has a forward P/E ratio of 60.5 according to its forward EPS of $1.61 -- which is an estimate of what its earnings will look like in the next quarter. As of the first quarter of 2023, the average Price to Earnings (P/E) ratio for US health care companies is 24.45, and the S&P 500 has an average of 15.97. The P/E ratio consists in the stock's share price divided by its earnings per share (EPS), representing how much investors are willing to spend for each dollar of the company's earnings. Earnings are the company's revenues minus the cost of goods sold, overhead, and taxes.
To better understand DXCM’s valuation, we can divide its price to earnings ratio by its projected five-year growth rate, which gives us its price to earnings, or PEG ratio. Considering the P/E ratio in the context of growth is important, because many companies that are undervalued in terms of earnings are actually overvalued in terms of growth.
DexCom’s PEG is 2.23, which indicates that the company is overvalued compared to its growth prospects. Bear in mind that PEG ratios have limits to their relevance, since they are based on future growth estimates that may not turn out as expected.
An analysis of the company's gross profit margins can help us understand its long term profitability and market position. Gross profits are the company's revenue minus the cost of goods only, and unlike earnings, don't take into account taxes and overhead. Here's an overview of DexCom's gross profit margin trends:
| Date Reported | Revenue ($ k) | Cost of Revenue ($ k) | Gross Margins (%) | YoY Growth (%) |
|---|---|---|---|---|
| 2023-02-09 | 2,909,800 | -1,026,700 | 65 | -5.8 |
| 2022-02-14 | 2,448,500 | -768,000 | 69 | 4.55 |
| 2021-02-11 | 1,926,700 | -646,600 | 66 | 4.76 |
| 2020-02-13 | 1,476,000 | -544,500 | 63 | -1.56 |
| 2019-02-21 | 1,031,600 | -367,700 | 64 | -5.88 |
| 2018-02-27 | 718,500 | -226,400 | 68 |
- Average gross margin: 65.8 %
- Average gross margin growth rate: -0.1 %
- Coefficient of variability (lower numbers indicating more stability): 3.5 %
We can see from the above that DexCom business is not strong and its stock is likely not suitable for conservative investors.
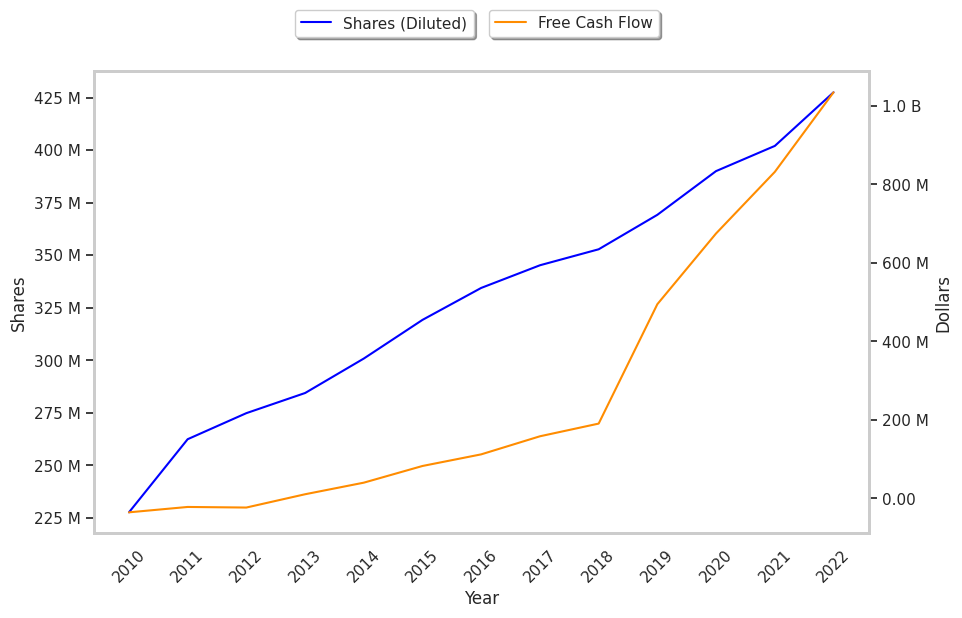
To deepen our understanding of the company's finances, we should study the effect of its depreciation and capital expenditures on the company's bottom line. We can see the effect of these additional factors in DexCom's free cash flow, which was $1.03 Billion as of its most recent annual report. This represents the amount of money that is available for reinvesting in the business, or for paying out to investors in the form of a dividend. With its strong cash flows, DXCM is in a position to do either -- which can encourage more investors to place their capital in the company. Over the last four years, the company's free cash flow has been growing at a rate of 0.0% and has on average been $563.9 Million.
Another valuation metric for analyzing a stock is its Price to Book (P/B) Ratio, which consists in its share price divided by its book value per share. The book value refers to the present liquidation value of the company, as if it sold all of its assets and paid off all debts). Dexcom's P/B ratio is 17.9 -- in other words, the market value of the company exceeds its book value by a factor of more than 17, so the company's assets may be overvalued compared to the average P/B ratio of the Health Care sector, which stands at 4.16 as of the first quarter of 2023.
Since it has an inflated P/E ratio, an elevated P/B ratio, and a pattern of improving cash flows with a flat trend, DexCom is likely overvalued at today's prices. The company has mixed growth prospects because of an inflated PEG ratio and weak operating margins with a positive growth rate. We hope you enjoyed this overview of DXCM's fundamentals. Be sure to check the numbers for yourself, especially focusing on their trends over the last few years.