It hasn't been a great afternoon session for HCA Healthcare investors, who have watched their shares sink by -2.5% to a price of $257.12. Some of you might be wondering if it's time to buy the dip. If you are considering this, make sure to check the company's fundamentals first to determine if the shares are fairly valued at today's prices.
HCA Healthcare Is Fairly Valued:
HCA Healthcare, Inc., through its subsidiaries, provides health care services in the United States. The company belongs to the Health Care sector, which has an average price to earnings (P/E) ratio of 24.45. In contrast, HCA Healthcare has a trailing 12 month P/E ratio of 12.7 based on its earnings per share of $20.25.
There is an important limit on the usefulness of P/E ratios. Since the P/E ratio is the share price divided by earnings per share, the ratio is determined partially by market sentiment on the stock. Sometimes a negative sentiment translates to a lower market price and therefore a lower P/E ratio -- and there might be good reasons for this negative sentiment.
One of the main reasons not to blindly invest in a company with a low P/E ratio is that it might have low growth expectations. Low growth correlates with low stock performance, so it's useful to factor growth into the valuation process. One of the easiest ways to do this is to divide the company's P/E ratio by its expected growth rate, which results in the price to earnings growth, or PEG ratio.
HCA Healthcare's PEG ratio is 1.42, which shows that the stock is overvalued in terms of its estimated growth. For reference, a PEG ratio near or below 1 is a potential signal that a company is undervalued.
Exceptional Profitability Overshadowed by Excessive Leverage:
| 2018-02-23 | 2019-02-21 | 2020-02-20 | 2021-02-19 | 2022-02-18 | 2023-02-17 | |
|---|---|---|---|---|---|---|
| Revenue (MM) | $43,614 | $46,677 | $51,336 | $51,533 | $58,752 | $60,233 |
| Gross Margins | 37.0% | 38.0% | 38.0% | 37.0% | 38.0% | 38.0% |
| Operating Margins | 14% | 14% | 14% | 14% | 16% | 15% |
| Net Margins | 5.0% | 8.0% | 7.0% | 7.0% | 12.0% | 9.0% |
| Net Income (MM) | $2,216 | $3,787 | $3,505 | $3,754 | $6,956 | $5,643 |
| Net Interest Expense (MM) | -$1,690 | -$1,755 | -$1,824 | -$1,584 | -$1,566 | -$1,741 |
| Depreciation & Amort. (MM) | -$2,131 | -$2,278 | -$2,596 | -$2,721 | -$2,853 | -$2,969 |
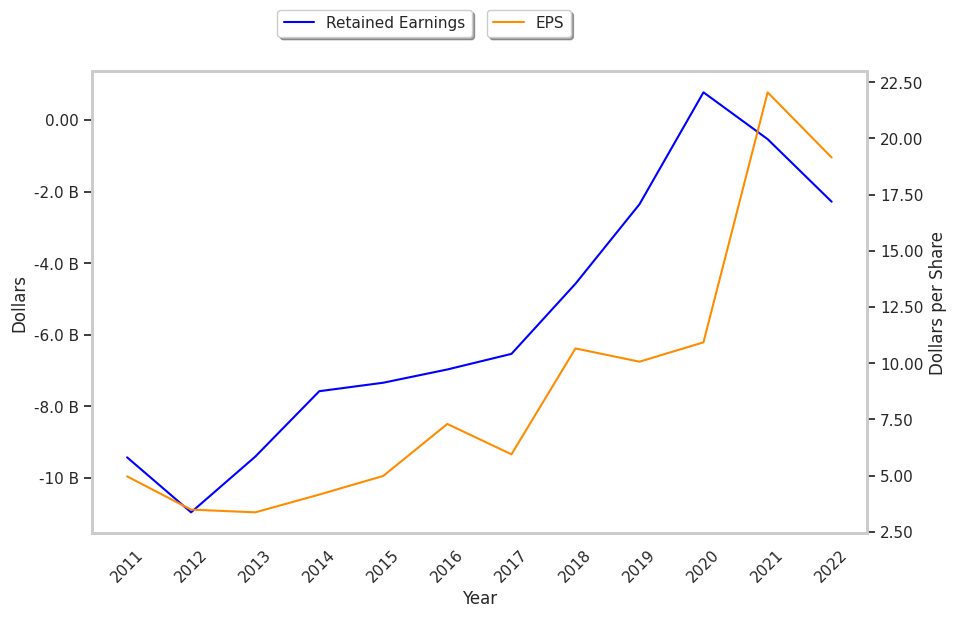
| Earnings Per Share | $5.95 | $10.66 | $10.07 | $10.93 | $22.05 | $19.15 |
| EPS Growth | n/a | 79.16% | -5.53% | 8.54% | 101.74% | -13.15% |
| Diluted Shares (MM) | 372 | 355 | 348 | 344 | 315 | 295 |
| Free Cash Flow (MM) | $8,441 | $10,334 | $11,760 | $12,067 | $12,536 | $12,917 |
| Capital Expenditures (MM) | -$3,015 | -$3,573 | -$4,158 | -$2,835 | -$3,577 | -$4,395 |
| Net Current Assets (MM) | -$31,611 | -$31,912 | -$34,427 | -$32,265 | -$35,711 | -$38,868 |
| Long Term Debt (MM) | $32,858 | $32,033 | $33,577 | $30,795 | $34,342 | $37,714 |
| Net Debt / EBITDA | 3.95 | 3.62 | 3.37 | 2.93 | 2.64 | 3.09 |
HCA Healthcare has strong margins with a stable trend, exceptional EPS growth, and a pattern of improving cash flows. However, the firm suffers from slimmer gross margins than its peers and a highly leveraged balance sheet. Finally, we note that HCA Healthcare has weak revenue growth and a flat capital expenditure trend and just enough current assets to cover current liabilities.