Kinder Morgan logged a -1.0% change during today's afternoon session, and is now trading at a price of $17.13 per share.
Over the last year, Kinder Morgan logged a -1.0% change, with its stock price reaching a high of $19.36 and a low of $16.0. Over the same period, the stock underperformed the S&P 500 index by -17.0%. As of April 2023, the company's 50-day average price was $17.35. Kinder Morgan, Inc. operates as an energy infrastructure company in North America. Based in Houston, TX, the large-cap Utilities company has 10,525 full time employees. Kinder Morgan has offered a 6.5% dividend yield over the last 12 months.
Exceptional Profitability Overshadowed by Excessive Leverage:
| 2018-02-09 | 2019-02-08 | 2020-02-12 | 2021-02-05 | 2022-02-07 | 2023-02-08 | |
|---|---|---|---|---|---|---|
| Revenue (MM) | $13,705 | $14,144 | $13,209 | $11,700 | $16,610 | $19,200 |
| Gross Margins | 68.0% | 69.0% | 75.0% | 78.0% | 61.0% | 52.0% |
| Operating Margins | 26% | 28% | 30% | 30% | 27% | 21% |
| Net Margins | 1.0% | 11.0% | 17.0% | 1.0% | 11.0% | 13.0% |
| Net Income (MM) | $183 | $1,609 | $2,190 | $119 | $1,784 | $2,548 |
| Net Interest Expense (MM) | -$1,832 | -$1,917 | -$1,801 | -$1,595 | -$1,492 | -$1,513 |
| Depreciation & Amort. (MM) | -$2,261 | -$2,297 | -$2,411 | -$2,164 | -$2,135 | -$2,186 |
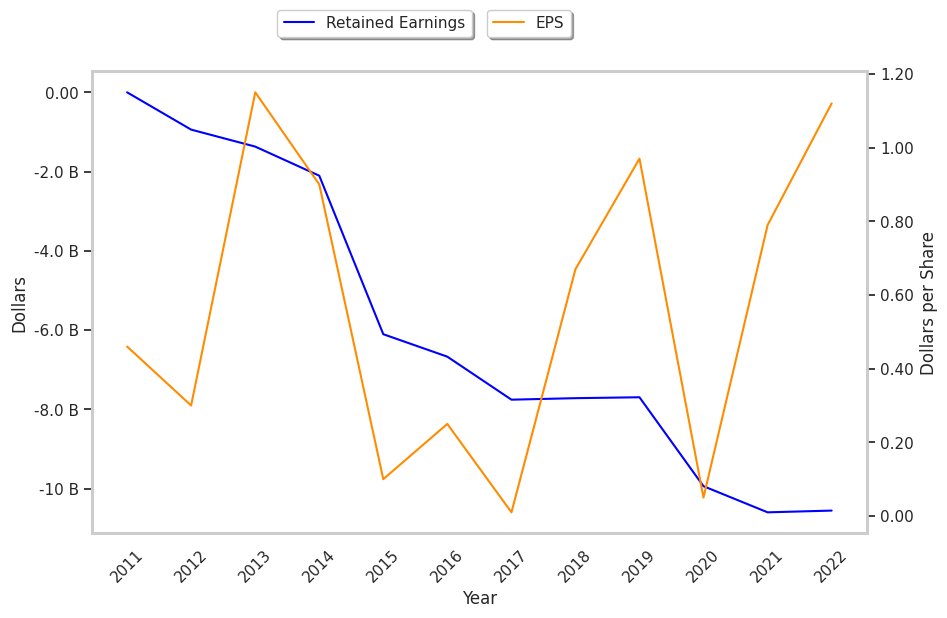
| Earnings Per Share | $0.01 | $0.67 | $0.97 | $0.05 | $0.79 | $1.12 |
| EPS Growth | n/a | 6600.0% | 44.78% | -94.85% | 1480.0% | 41.77% |
| Diluted Shares (MM) | 2,230 | 2,216 | 2,264 | 2,263 | 2,267 | 2,265 |
| Free Cash Flow (MM) | $7,671 | $7,843 | $6,936 | $5,188 | $6,583 | $6,582 |
| Capital Expenditures (MM) | -$3,070 | -$2,800 | -$2,188 | -$638 | -$875 | -$1,615 |
| Net Current Assets (MM) | -$41,216 | -$37,947 | -$36,030 | -$36,204 | -$34,666 | -$34,161 |
| Long Term Debt (MM) | $33,988 | $33,105 | $30,883 | $30,838 | $29,772 | $28,288 |
| Net Debt / EBITDA | 6.3 | 5.31 | 5.09 | 5.7 | 4.69 | 4.97 |
Kinder Morgan has strong margins with a stable trend, exceptional EPS growth, and wider gross margins than its peer group. However, the firm has a highly leveraged balance sheet. Finally, we note that Kinder Morgan has weak revenue growth and a flat capital expenditure trend and irregular cash flows.
Kinder Morgan Is Reasonably Valued:
Kinder Morgan has a trailing twelve month P/E ratio of 15.6, compared to an average of 22.89 for the Utilities sector. Based on its EPS guidance of $1.21, the company has a forward P/E ratio of 14.3. The company doesn't provide forward earnings guidance, and the compound average growth rate of its last 6 years of reported EPS is 119.2%. On this basis, Kinder Morgan's PEG ratio is 0.13. Using instead the 11.7% weighted average of Kinder Morgan's earnings CAGR and the broader market's anticipated 5-year EPS growth rate, the company's PEG ratio is 1.34, which shows that its shares might be fairly priced. In contrast, Kinder Morgan is likely overvalued compared to the book value of its equity, since its P/B ratio of 1.25 is higher than the sector average of 1.03. The company's shares are currently trading -9.4% below their Graham number.
Kinder Morgan Has an Average Rating of Hold:
The 17 analysts following Kinder Morgan have set target prices ranging from $18.0 to $23.0 per share, for an average of $20.29 with a hold rating. As of April 2023, the company is trading -14.5% away from its average target price, indicating that there is an analyst consensus of some upside potential.
Kinder Morgan has a very low short interest because 1.9% of the company's shares are sold short. Institutions own 64.4% of the company's shares, and the insider ownership rate stands at 12.69%, suggesting a large amount of insider shareholders. The largest shareholder is Vanguard Group Inc, whose 8% stake in the company is worth $2,971,333,030.