It's been a great afternoon session for AT&T investors, who saw their shares rise 1.5% to a price of $15.29 per share. At these higher prices, is the company still fairly valued? If you are thinking about investing, make sure to check the company's fundamentals before making a decision.
AT&T Has an Attractive P/B Ratio but a Worrisome P/E Ratio:
AT&T Inc. provides telecommunications and technology services worldwide. The company belongs to the Telecommunications sector, which has an average price to earnings (P/E) ratio of 18.85 and an average price to book (P/B) ratio of 3.12. In contrast, AT&T has a trailing 12 month P/E ratio of -13.1 and a P/B ratio of 1.07.
When we divide AT&T's P/E ratio by its expected EPS growth rate of the next five years, we obtain its PEG ratio of -12.25. Since it's negative, the company has negative growth expectations, and most investors will probably avoid the stock unless it has an exceptionally low P/E and P/B ratio.
The Company May Be Profitable, but Its Balance Sheet Is Highly Leveraged:
| 2018-02-20 | 2019-02-20 | 2020-02-20 | 2021-02-25 | 2022-02-16 | 2023-02-13 | |
|---|---|---|---|---|---|---|
| Revenue (MM) | $160,546 | $170,756 | $181,193 | $143,050 | $134,038 | $120,741 |
| Gross Margins | 52.0% | 53.0% | 54.0% | 54.0% | 55.0% | 57.0% |
| Operating Margins | 14% | 15% | 16% | 17% | 19% | 19% |
| Net Margins | 18.0% | 11.0% | 8.0% | -4.0% | 15.0% | -7.0% |
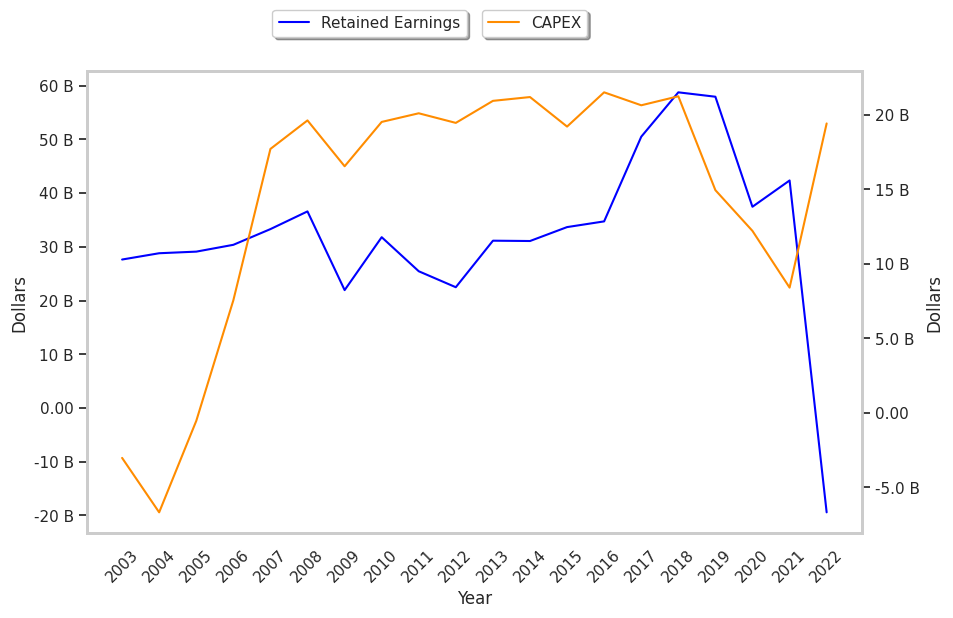
| Net Income (MM) | $29,450 | $19,370 | $13,903 | -$5,176 | $20,081 | -$8,524 |
| Net Interest Expense (MM) | -$6,300 | -$7,957 | -$8,422 | -$7,727 | -$6,716 | -$6,108 |
| Depreciation & Amort. (MM) | -$24,387 | -$28,430 | -$28,217 | -$22,523 | -$17,852 | -$18,021 |
| Earnings Per Share | $4.76 | $2.85 | $1.89 | -$0.75 | $2.76 | -$1.21 |
| EPS Growth | n/a | -40.13% | -33.68% | -139.68% | 468.0% | -143.84% |
| Diluted Shares (MM) | 6,183 | 6,806 | 7,348 | 7,183 | 7,204 | 7,199 |
| Free Cash Flow (MM) | $58,657 | $64,853 | $63,619 | $49,702 | $45,579 | $55,239 |
| Capital Expenditures (MM) | -$20,647 | -$21,251 | -$14,951 | -$12,218 | -$8,409 | -$19,427 |
| Net Current Assets (MM) | -$222,944 | -$286,553 | -$294,974 | -$294,513 | -$196,999 | -$263,288 |
| Long Term Debt (MM) | $125,972 | $166,250 | $151,309 | $153,775 | $151,011 | $128,423 |
| Net Debt / EBITDA | 2.41 | 3.14 | 2.62 | 3.17 | 3.56 | 3.23 |
AT&T has slimmer gross margins than its peers, declining EPS growth, and a highly leveraged balance sheet. On the other hand, the company has average operating margins with a positive growth rate working in its favor. Furthermore, AT&T has weak revenue growth and a flat capital expenditure trend and irregular cash flows.