Valero Energy shares fell by -1.7% during the day's afternoon session, and are now trading at a price of $143.4. Is it time to buy the dip? To better answer that question, it's essential to check if the market is valuing the company's shares fairly in terms of its earnings and equity levels.
Valero Energy Is Fairly Valued:
Valero Energy Corporation manufactures, markets, and sells transportation fuels and petrochemical products in the United States, Canada, the United Kingdom, Ireland, Latin America, and internationally. The company belongs to the Energy sector, which has an average price to earnings (P/E) ratio of 7.54 and an average price to book (P/B) ratio of 1.68. In contrast, Valero Energy has a trailing 12 month P/E ratio of 4.9 and a P/B ratio of 1.96.
When we divide Valero Energy's P/E ratio by its expected EPS growth rate of the next five years, we obtain its PEG ratio of -0.28. Since it's negative, the company has negative growth expectations, and most investors will probably avoid the stock unless it has an exceptionally low P/E and P/B ratio.
Exceptional EPS Growth at the Expense of a Highly Leveraged Balance Sheet:
| 2018-02-28 | 2019-02-28 | 2020-02-26 | 2021-02-23 | 2022-02-22 | 2023-02-23 | |
|---|---|---|---|---|---|---|
| Revenue (MM) | $93,980 | $117,033 | $108,324 | $64,912 | $113,977 | $176,383 |
| Gross Margins | 5.0% | 5.0% | 4.0% | -1.0% | 3.0% | 10.0% |
| Operating Margins | 4% | 4% | 4% | -2% | 2% | 9% |
| Net Margins | 4.0% | 3.0% | 2.0% | -2.0% | 1.0% | 7.0% |
| Net Income (MM) | $4,065 | $3,122 | $2,422 | -$1,421 | $930 | $11,528 |
| Net Interest Expense (MM) | -$468 | -$470 | -$454 | -$563 | -$603 | -$562 |
| Depreciation & Amort. (MM) | -$1,986 | -$2,069 | -$2,255 | -$2,351 | -$2,405 | -$2,473 |
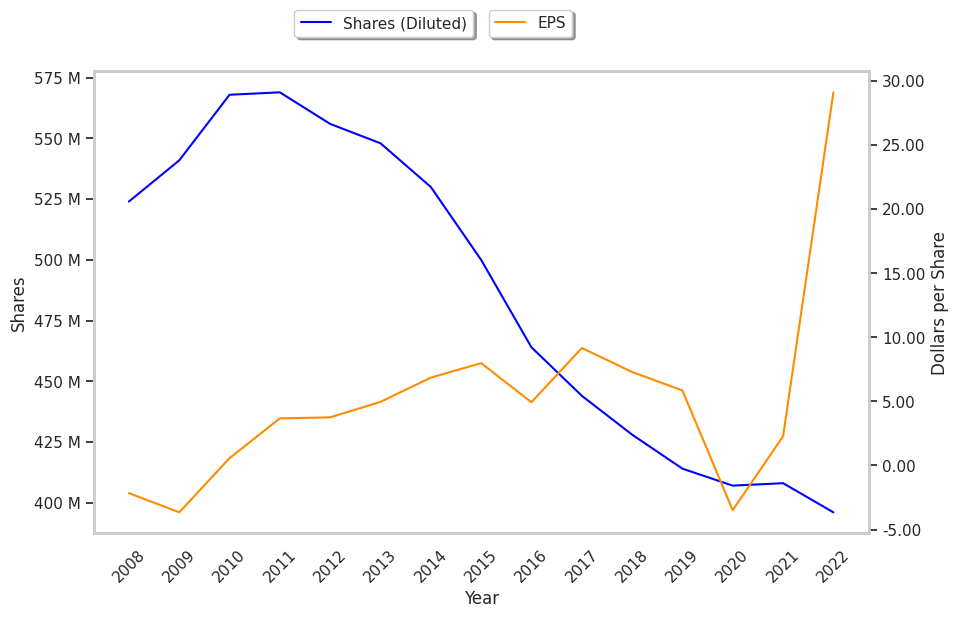
| Earnings Per Share | $9.16 | $7.29 | $5.85 | -$3.49 | $2.28 | $29.11 |
| EPS Growth | n/a | -20.41% | -19.75% | -159.66% | 165.33% | 1176.75% |
| Diluted Shares (MM) | 444 | 428 | 414 | 407 | 408 | 396 |
| Free Cash Flow (MM) | $6,835 | $6,242 | $7,158 | $1,962 | $6,102 | $13,330 |
| Capital Expenditures (MM) | -$1,353 | -$1,871 | -$1,627 | -$1,014 | -$243 | -$756 |
| Net Current Assets (MM) | -$7,946 | -$9,749 | -$12,359 | -$16,288 | -$16,906 | -$11,381 |
| Long Term Debt (MM) | $8,750 | $8,871 | $9,178 | $13,954 | $12,606 | $10,526 |
| Net Debt / EBITDA | 0.54 | 0.92 | 1.16 | 14.72 | 2.15 | 0.37 |
Valero Energy has slimmer gross margins than its peers, weak operating margins with a positive growth rate, and a highly leveraged balance sheet. On the other hand, the company has exceptional EPS growth working in its favor. Furthermore, Valero Energy has weak revenue growth and a flat capital expenditure trend, irregular cash flows, and just enough current assets to cover current liabilities.