Many investors turn to Benjamin Graham's so-called “Graham number” to calculate the fair price of a stock. The Graham number is √(22.5 * 5 year average earnings per share * book value per share), which for General Mills gives us a fair price of $41.39. In comparison, the stock’s market price is $65.85 per share. Therefore, General Mills’s market price exceeds the upper bound that a prudent investor would pay for its shares by 59.1%.
The Graham number is often used in isolation, but in fact it is only one part of a check list for choosing defensive stocks that he laid out in Chapter 14 of The Intelligent Investor. The analysis requires us to look at the following fundamentals of General Mills:
Sales Revenue Should Be No Less Than $500 million
For General Mills, average sales revenue over the last 6 years has been $28.81 Billion, so in the context of the Graham analysis the stock has impressive sales revenue. Originally the threshold was $100 million, but since the book was published in the 1970s it's necessary to adjust the figure for inflation.
Current Assets Should Be at Least Twice Current Liabilities
We calculate General Mills's current ratio by dividing its total current assets of $5.09 Billion by its total current liabilities of $8.02 Billion. Current assets refer to company assets that can be transferred into cash within one year, such as accounts receivable, inventory, and liquid financial instruments. Current liabilities, on the other hand, refer to those that will come due within one year. General Mills’s current liabilities are actually greater than its current assets, since its current ratio is only 0.6.
The Company’s Long-term Debt Should Not Exceed its Net Current Assets
This means that its ratio of debt to net current assets should be 1 or less. Since General Mills’s debt ratio is -0.6, the company has much more liabilities than current assets. We calculate General Mills’s debt to net current assets ratio by dividing its total long term of debt of $9.13 Billion by its current assets minus total liabilities of $20.3 Billion.
The Stock Should Have a Positive Level of Retained Earnings Over Several Years
General Mills had positive retained earnings from 2009 to 2023 with an average of $13.04 Billion. Retained earnings are the sum of the current and previous reporting periods' net asset amounts, minus all dividend payments. It's a similar metric to free cash flow, with the difference that retained earnings are accounted for on an accrual basis.
There Should Be a Record of Uninterrupted Dividend Payments Over the Last 20 Years
Shareholders of General Mills have received regular dividends since 2011. The company has returned an average dividend yield of 3.3% over the last five years.
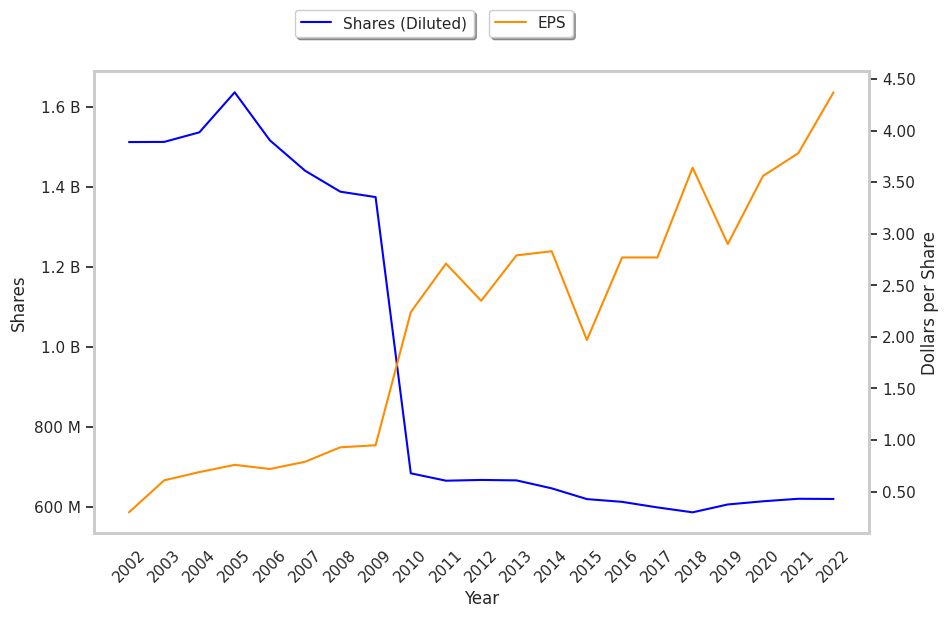
A Minimum Increase of at Least One-third in Earnings per Share (EPS) Over the Past 10 Years
We are going to compare General Mills's earnings per share averages from the two 'bookends' of the 16 year period for which we have data. The first bookend comprises the years 2008, 2009, and 2010, whose EPS values of $1.85, $0.83, and $0.92 average out to $1.20. Next we look at the years 2021, 2022, and 2023, whose values of $0.97, $1.01, and $1.03 average out to $1.00. The growth rate between the two averages does not meet Graham's standard since it is -16.67%.
It may be trading far above its fair value, but General Mills actually does not have the profile of a defensive stock according to Benjamin Graham's criteria because it has:
- impressive sales revenue
- not enough current assets to cover current liabilities
- much more liabilities than current assets
- positive retained earnings from 2009 to 2023
- a solid record of dividends
- decreasing earnings per share