We've been asking ourselves recently if the market has placed a fair valuation on CVS Health. Let's dive into some of the fundamental values of this large-cap Consumer Staples company to determine if there might be an opportunity here for value-minded investors.
Trades Below Its Graham Number but Has an Elevated P/E Ratio:
CVS Health Corporation provides health services in the United States. The company belongs to the Consumer Staples sector, which has an average price to earnings (P/E) ratio of 24.36 and an average price to book (P/B) ratio of 4.29. In contrast, CVS Health has a trailing 12 month P/E ratio of 32.3 and a P/B ratio of 1.25.
CVS Health's PEG ratio is 1.88, which shows that the stock is probably overvalued in terms of its estimated growth. For reference, a PEG ratio near or below 1 is a potential signal that a company is undervalued.
Healthy Debt Levels but a Declining EPS Growth Trend:
| 2017-02-09 | 2018-02-14 | 2019-02-28 | 2020-02-18 | 2021-02-16 | 2022-02-09 | |
|---|---|---|---|---|---|---|
| Revenue (MM) | $177,546 | $184,786 | $194,579 | $256,776 | $268,706 | $292,111 |
| Gross Margins | 16.0% | 15.0% | 16.0% | 18.0% | 18.0% | 18.0% |
| Operating Margins | 6% | 5% | 5% | 5% | 5% | 5% |
| Net Margins | 3.0% | 4.0% | 0.0% | 3.0% | 3.0% | 3.0% |
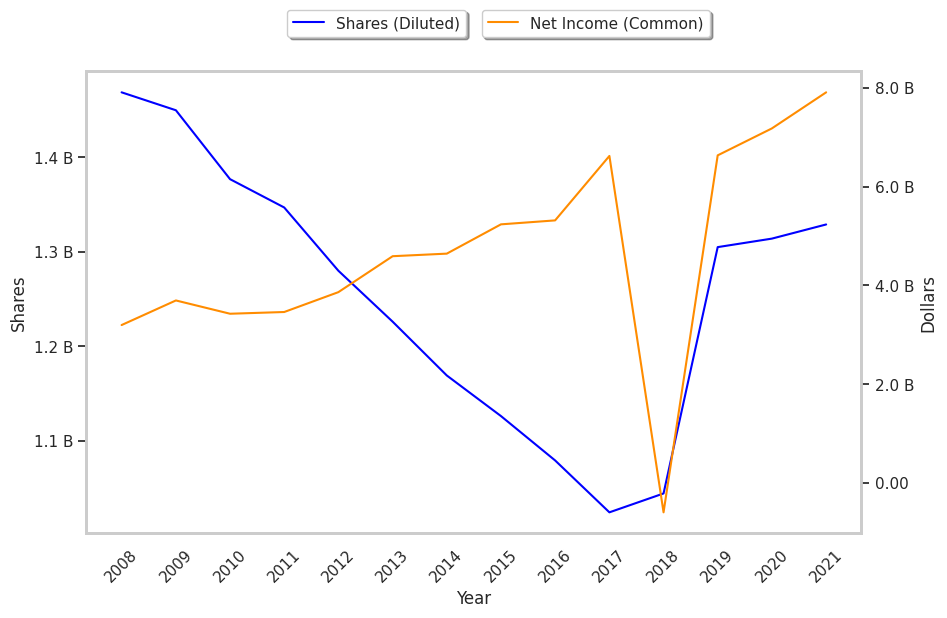
| Net Income (MM) | $5,317 | $6,622 | -$594 | $6,634 | $7,179 | $7,910 |
| Net Interest Expense (MM) | -$1,078 | -$1,062 | -$2,619 | -$3,035 | -$2,907 | -$2,503 |
| Earnings Per Share | $4.93 | $6.47 | -$0.57 | $5.08 | $5.46 | $5.95 |
| EPS Growth | n/a | 31.24% | -108.81% | 991.23% | 7.48% | 8.97% |
| Diluted Shares (MM) | 1,079 | 1,024 | 1,044 | 1,305 | 1,314 | 1,329 |
| Free Cash Flow (MM) | $12,365 | $9,925 | $10,070 | $15,305 | $18,302 | $20,785 |
| Capital Expenditures (MM) | -$2,224 | -$1,918 | -$1,205 | -$2,457 | -$2,437 | -$2,520 |
| Net Current Assets (MM) | -$26,586 | -$26,207 | -$92,670 | -$107,977 | -$104,645 | -$97,610 |
| Long Term Debt (MM) | $25,615 | $22,181 | $71,444 | $64,699 | $59,207 | $51,971 |
CVS Health has a pattern of improving cash flows, healthy debt levels, and average operating margins with a stable trend. However, the firm suffers from slimmer gross margins than its peers and declining EPS growth. Finally, we note that CVS Health has weak revenue growth and a flat capital expenditure trend.