We've been asking ourselves recently if the market has placed a fair valuation on DexCom. Let's dive into some of the fundamental values of this large-cap Health Care company to determine if there might be an opportunity here for value-minded investors.
DexCom's P/B and P/E Ratios Are Higher Than Average:
DexCom, Inc., a medical device company, focuses on the design, development, and commercialization of continuous glucose monitoring (CGM) systems in the United States and internationally. The company belongs to the Health Care sector, which has an average price to earnings (P/E) ratio of 24.45 and an average price to book (P/B) ratio of 4.16. In contrast, DexCom has a trailing 12 month P/E ratio of 115.8 and a P/B ratio of 17.67.
DexCom's PEG ratio is 2.12, which shows that the stock is probably overvalued in terms of its estimated growth. For reference, a PEG ratio near or below 1 is a potential signal that a company is undervalued.
The Company Has a Positive Net Current Asset Value:
| 2018-02-27 | 2019-02-21 | 2020-02-13 | 2021-02-11 | 2022-02-14 | 2023-02-09 | |
|---|---|---|---|---|---|---|
| Revenue (MM) | $718 | $1,032 | $1,476 | $1,927 | $2,448 | $2,910 |
| Gross Margins | 68.0% | 64.0% | 63.0% | 66.0% | 69.0% | 65.0% |
| Operating Margins | -6% | 3% | 10% | 16% | 14% | 13% |
| Net Margins | -7.0% | -12.0% | 7.0% | 28.0% | 9.0% | 12.0% |
| Net Income (MM) | -$50 | -$127 | $101 | $550 | $217 | $341 |
| Net Interest Expense (MM) | -$10 | -$23 | -$60 | -$18 | -$19 | -$19 |
| Depreciation & Amort. (MM) | -$16 | -$29 | -$49 | -$67 | -$102 | -$156 |
| Earnings Per Share | -$0.15 | -$0.36 | $0.27 | $1.41 | $0.54 | $0.8 |
| EPS Growth | n/a | -140.0% | 175.0% | 422.22% | -61.7% | 48.15% |
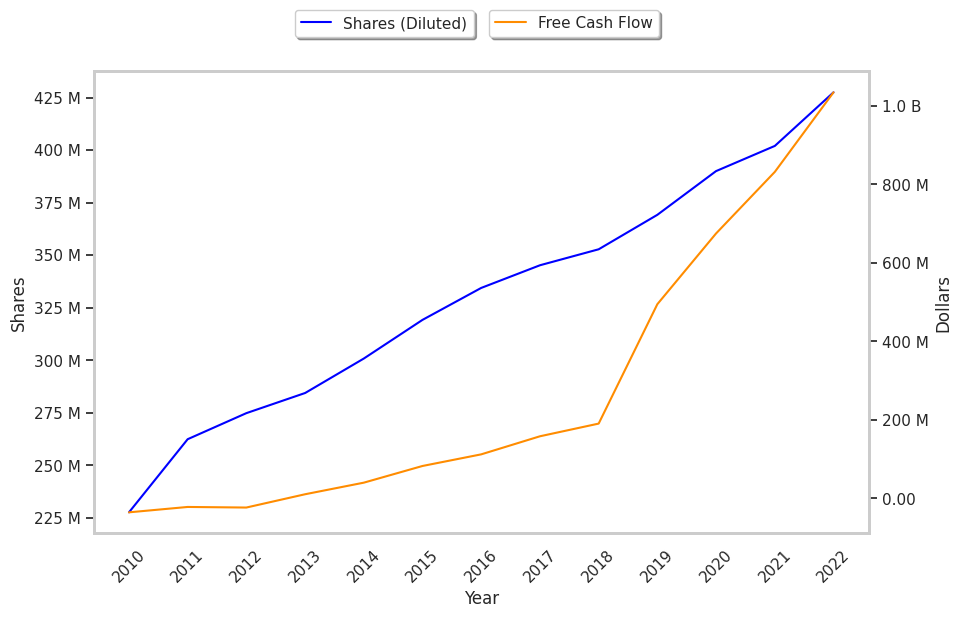
| Diluted Shares (MM) | 345 | 353 | 369 | 390 | 402 | 428 |
| Free Cash Flow (MM) | $158 | $190 | $494 | $675 | $832 | $1,034 |
| Capital Expenditures (MM) | -$66 | -$67 | -$180 | -$199 | -$389 | -$365 |
| Net Current Assets (MM) | $260 | $447 | $457 | $961 | $793 | $409 |
| Long Term Debt (MM) | $328 | $1,010 | $1,060 | $1,667 | $1,982 | $1,198 |
| Net Debt / EBITDA | 8.37 | -6.2 | -2.48 | -2.79 | -1.6 | -0.85 |
DexCom has exceptional EPS growth, a pattern of improving cash flows, and wider gross margins than its peer group. However, the firm has weak operating margins with a positive growth rate. Finally, we note that DexCom has weak revenue growth and a flat capital expenditure trend, a decent current ratio, and significant leverage.