Verizon Communications logged a -0.4% change during today's afternoon session, and is now trading at a price of $33.39 per share.
Verizon Communications returned losses of -15.0% last year, with its stock price reaching a high of $42.58 and a low of $31.25. Over the same period, the stock underperformed the S&P 500 index by -31.0%. As of April 2023, the company's 50-day average price was $33.68. Verizon Communications Inc., through its subsidiaries, provides communications, technology, information, and entertainment products and services to consumers, businesses, and governmental entities worldwide. Based in New York, NY, the large-cap Telecommunications company has 117,100 full time employees. Verizon Communications has offered a 7.8% dividend yield over the last 12 months.
Exceptional Profitability Overshadowed by Excessive Leverage:
| 2018-02-23 | 2019-02-15 | 2020-02-21 | 2021-02-25 | 2022-02-11 | 2023-02-10 | |
|---|---|---|---|---|---|---|
| Revenue (MM) | $126,034 | $130,863 | $131,868 | $128,292 | $133,613 | $136,835 |
| Gross Margins | 57.0% | 57.0% | 57.0% | 60.0% | 57.0% | 56.0% |
| Operating Margins | 22% | 21% | 23% | 22% | 24% | 22% |
| Net Margins | 24.0% | 12.0% | 15.0% | 14.0% | 17.0% | 16.0% |
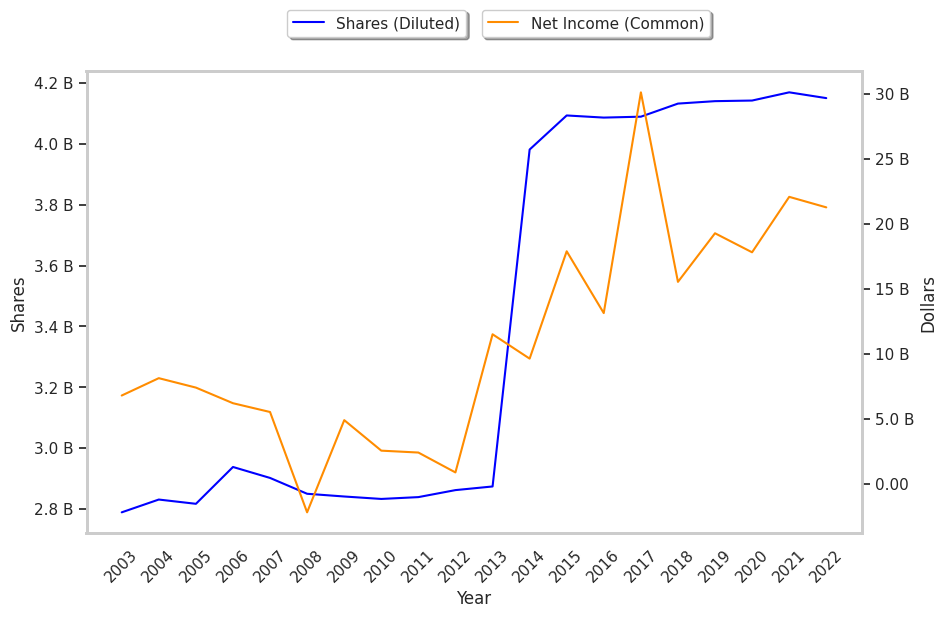
| Net Income (MM) | $30,101 | $15,528 | $19,265 | $17,801 | $22,065 | $21,256 |
| Net Interest Expense (MM) | -$4,733 | -$4,833 | -$4,730 | -$4,247 | -$3,485 | -$3,613 |
| Depreciation & Amort. (MM) | -$16,954 | -$17,403 | -$16,682 | -$16,720 | -$16,206 | -$17,099 |
| Earnings Per Share | $7.36 | $3.76 | $4.65 | $4.3 | $5.29 | $5.12 |
| EPS Growth | n/a | -48.91% | 23.67% | -7.53% | 23.02% | -3.21% |
| Diluted Shares (MM) | 4,089 | 4,132 | 4,140 | 4,142 | 4,169 | 4,150 |
| Free Cash Flow (MM) | $42,148 | $52,426 | $54,583 | $63,856 | $107,421 | $63,881 |
| Capital Expenditures (MM) | -$17,830 | -$18,087 | -$18,837 | -$22,088 | -$67,882 | -$26,740 |
| Net Current Assets (MM) | -$182,543 | -$175,483 | -$191,419 | -$192,615 | -$246,668 | -$249,360 |
| Long Term Debt (MM) | $113,642 | $105,873 | $100,712 | $123,173 | $143,425 | $140,676 |
| Net Debt / EBITDA | 2.59 | 2.49 | 2.3 | 2.35 | 3.04 | 3.11 |
Verizon Communications has slimmer gross margins than its peers, declining EPS growth, and a highly leveraged balance sheet. On the other hand, the company has strong margins with a stable trend working in its favor. Furthermore, Verizon Communications has weak revenue growth and a flat capital expenditure trend and irregular cash flows.
Verizon Communications Has Attractive Multiples and Trades Below Its Graham Number:
Verizon Communications has a trailing twelve month P/E ratio of 6.7, compared to an average of 18.85 for the Telecommunications sector. Based on its EPS guidance of $4.7, the company has a forward P/E ratio of 7.2. The company doesn't issue forward earnings guidance, and the compound average growth rate of its last 6 years of reported EPS is -6.2%. On this basis, the company's PEG ratio is -1.08, which indicates that its shares are overpriced. In contrast, the market is likely undervaluing Verizon Communications in terms of its equity because its P/B ratio is 1.47 while the sector average is 3.12. The company's shares are currently trading -34.1% below their Graham number.
Verizon Communications Has an Analyst Consensus of Some Upside Potential:
The 21 analysts following Verizon Communications have set target prices ranging from $30.0 to $64.0 per share, for an average of $40.19 with a hold rating. As of April 2023, the company is trading -16.2% away from its average target price, indicating that there is an analyst consensus of some upside potential.
Verizon Communications has a very low short interest because 1.0% of the company's shares are sold short. Institutions own 63.9% of the company's shares, and the insider ownership rate stands at 0.03%, suggesting a small amount of insider investors. The largest shareholder is Vanguard Group Inc, whose 8% stake in the company is worth $11,709,378,697.