Boeing logged a 0.1% change during today's afternoon session, and is now trading at a price of $204.68 per share.
Boeing returned gains of 43.0% last year, with its stock price reaching a high of $243.1 and a low of $120.99. Over the same period, the stock outperformed the S&P 500 index by 24.0%. More recently, the company's 50-day average price was $222.99. The Boeing Company, together with its subsidiaries, designs, develops, manufactures, sells, services, and supports commercial jetliners, military aircraft, satellites, missile defense, human space flight and launch systems, and services worldwide. Based in Arlington, VA, the large-cap Industrials company has 156,000 full time employees. Boeing has not offered a dividend during the last year.
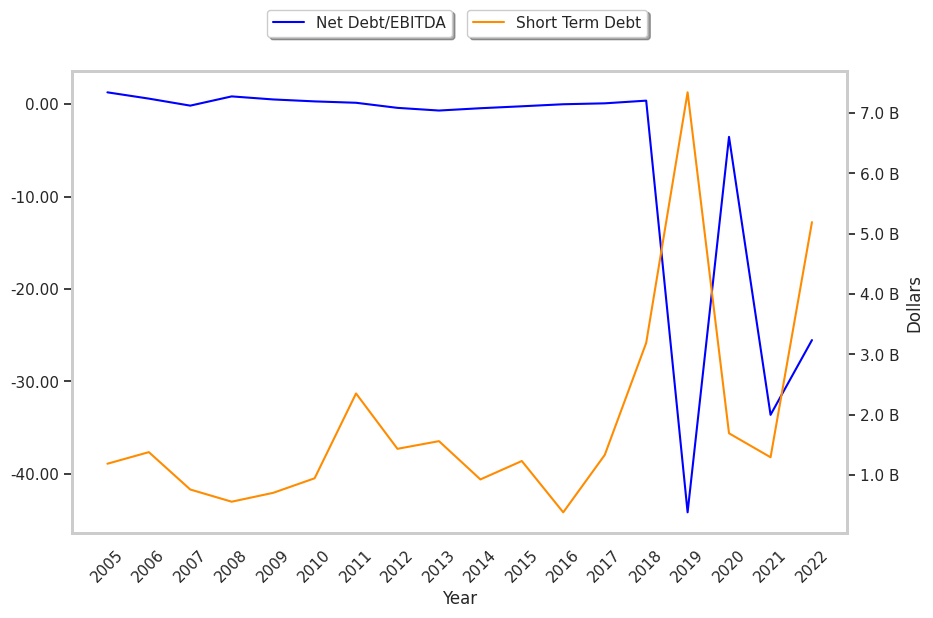
The Company Has a Negative Equity Levels:
| 2018-02-12 | 2019-02-08 | 2020-01-31 | 2021-02-01 | 2022-01-31 | 2023-01-27 | |
|---|---|---|---|---|---|---|
| Revenue (MM) | $94,005 | $101,127 | $76,559 | $58,158 | $62,286 | $66,608 |
| Gross Margins | 19.0% | 19.0% | 6.0% | -10.0% | 5.0% | 5.0% |
| Operating Margins | 11% | 12% | -3% | -22% | -5% | -5% |
| Net Margins | 9.0% | 10.0% | -1.0% | -20.0% | -7.0% | -7.0% |
| Net Income (MM) | $8,458 | $10,460 | -$636 | -$11,873 | -$4,202 | -$4,935 |
| Net Interest Expense (MM) | -$360 | -$475 | -$722 | -$2,156 | -$2,682 | -$2,533 |
| Depreciation & Amort. (MM) | -$2,047 | -$2,114 | -$2,271 | -$2,246 | -$2,144 | -$1,979 |
| Earnings Per Share | $13.87 | $18.04 | -$1.12 | -$20.87 | -$7.14 | -$8.28 |
| EPS Growth | n/a | 30.06% | -106.21% | -1763.39% | 65.79% | -15.97% |
| Diluted Shares (MM) | 610 | 580 | 566 | 569 | 589 | 596 |
| Free Cash Flow (MM) | $15,124 | $16,924 | -$1,283 | -$17,403 | -$2,965 | $4,699 |
| Capital Expenditures (MM) | -$1,778 | -$1,602 | -$1,163 | -$1,007 | -$451 | -$1,187 |
| Net Current Assets (MM) | -$25,455 | -$29,119 | -$39,696 | -$48,569 | -$44,732 | -$43,425 |
| Long Term Debt (MM) | $9,782 | $10,657 | $19,962 | $61,890 | $56,806 | $51,811 |
Boeing has slimmer gross margins than its peers, consistently negative margins with a negative growth trend, and declining EPS growth. Boeing has weak revenue growth and a flat capital expenditure trend, irregular cash flows, and just enough current assets to cover current liabilities.
Boeing does not have a meaningful trailing P/E ratio since its earnings per share are currently in the red. Based on its EPS guidance of $4.52, the company has a forward P/E ratio of 49.3. In comparison, the average P/E ratio for the Industrials sector is 20.49.
Boeing Has an Average Rating of Buy:
The 25 analysts following Boeing have set target prices ranging from $180.0 to $310.0 per share, for an average of $251.78 with a buy rating. As of April 2023, the company is trading -11.4% away from its average target price, indicating that there is an analyst consensus of some upside potential.
Boeing has a very low short interest because 1.2% of the company's shares are sold short. Institutions own 61.1% of the company's shares, and the insider ownership rate stands at 0.09%, suggesting a small amount of insider investors. The largest shareholder is Vanguard Group Inc, whose 8% stake in the company is worth $9,671,746,150.