Westrock Company is currently trading at $36.12 per share and has a Graham number of $58.24, which implies that it is -38.0% below its fair value. We calculate the Graham number as follows:
√(22.5 * 5 year average earnings per share * book value per share) = √(22.5 * 2.9 * 39.047) = 58.24
The Graham number is one of seven factors that Graham enumerates in Chapter 14 of The Intelligent Investor for determining whether a stock offers a margin of safety. Rather than use the Graham number by itself, its best to consider it alongside the following fundamental metrics:
Sales Revenue Should Be No Less Than $500 million
For Westrock Company, average sales revenue over the last 6 years has been $22.05 Billion, so in the context of the Graham analysis the stock has impressive sales revenue. Originally the threshold was $100 million, but since the book was published in the 1970s it's necessary to adjust the figure for inflation.
Current Assets Should Be at Least Twice Current Liabilities
We calculate Westrock Company's current ratio by dividing its total current assets of $5.99 Billion by its total current liabilities of $3.9 Billion. Current assets refer to company assets that can be transferred into cash within one year, such as accounts receivable, inventory, and liquid financial instruments. Current liabilities, on the other hand, refer to those that will come due within one year. Westrock Company’s current assets outweigh its current liabilities by a factor of 1.5 only.
The Company’s Long-term Debt Should Not Exceed its Net Current Assets
This means that its ratio of debt to net current assets should be 1 or less. Since Westrock Company’s debt ratio is -0.7, the company has much more liabilities than current assets. We calculate Westrock Company’s debt to net current assets ratio by dividing its total long term of debt of $7.58 Billion by its current assets minus total liabilities of $16.98 Billion.
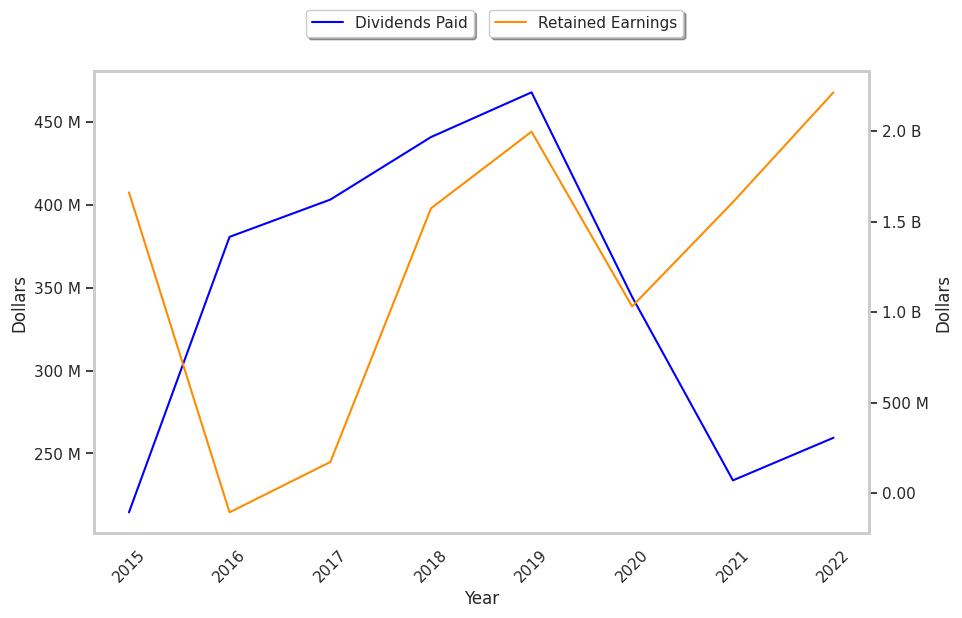
The Stock Should Have a Positive Level of Retained Earnings Over Several Years
Westrock Company had positive retained earnings from 2017 to 2022 with an average of $1.43 Billion. Retained earnings are the sum of the current and previous reporting periods' net asset amounts, minus all dividend payments. It's a similar metric to free cash flow, with the difference that retained earnings are accounted for on an accrual basis.
There Should Be a Record of Uninterrupted Dividend Payments Over the Last 20 Years
Shareholders of Westrock Company have received regular dividends since 2016. The company has returned an average dividend yield of 3.5% over the last five years.
A Minimum Increase of at Least One-third in Earnings per Share (EPS) Over the Past 10 Years
There are only 7 years of EPS data available on Westrock Company, which is short of the required 10, but it's still worthwhile to consider its EPS trend over the available period. First, we will average out its EPS for 2016 and 2017 which were $0.32 and $4.38 respectively. This gives us an average of $2.35 for the period of 2016 to 2017. Next, we compare this value with the average EPS reported in 2021 and 2022, which were $3.13 and $3.61, for an average of $3.37. Now we see that Westrock Company's EPS growth was 43.4% during this period, which satisfies Ben Graham's requirement for growth.
Based on the above analysis, we can conclude that Westrock Company meets most of Benjamin Graham's criteria for an undervalued stock because it is trading far below its fair value and has:
- impressive sales revenue
- just enough current assets to cover current liabilities
- much more liabilities than current assets
- positive retained earnings from 2017 to 2022
- an acceptable record of dividends
- EPS growth in excess of Graham's requirements