Archer-Daniels-Midland Company shares fell by -1.9% during the day's afternoon session, and are now trading at a price of $77.41. Is it time to buy the dip? To better answer that question, it's essential to check if the market is valuing the company's shares fairly in terms of its earnings and equity levels.
The Market May Be Undervaluing Archer-Daniels-Midland Company's Earnings and Assets:
Archer-Daniels-Midland Company procures, transports, stores, processes, and merchandises agricultural commodities, products, and ingredients in the United States, Switzerland, the Cayman Islands, Brazil, Mexico, Canada, the United Kingdom, and internationally. The company belongs to the Consumer Staples sector, which has an average price to earnings (P/E) ratio of 24.36 and an average price to book (P/B) ratio of 4.29. In contrast, Archer-Daniels-Midland Company has a trailing 12 month P/E ratio of 10.4 and a P/B ratio of 1.66.
When we divide Archer-Daniels-Midland Company's P/E ratio by its expected EPS growth rate of the next five years, we obtain its PEG ratio of -18.28. Since it's negative, the company has negative growth expectations, and most investors will probably avoid the stock unless it has an exceptionally low P/E and P/B ratio.
The Company Has a Positive Net Current Asset Value:
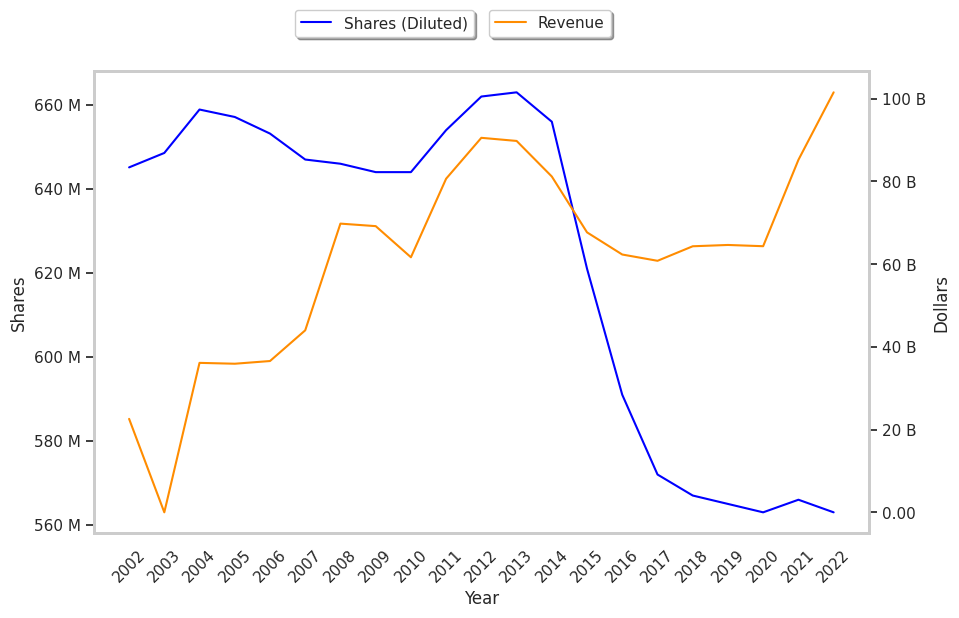
| 2017-12-31 | 2018-12-31 | 2019-12-31 | 2021-02-18 | 2022-02-17 | 2023-02-14 | |
|---|---|---|---|---|---|---|
| Revenue (MM) | $60,828 | $64,341 | $64,656 | $64,355 | $85,249 | $101,556 |
| Gross Margins | 6.0% | 6.0% | 6.0% | 7.0% | 7.0% | 7.0% |
| Operating Margins | 3% | 3% | 3% | 3% | 4% | 4% |
| Net Margins | 3.0% | 3.0% | 2.0% | 3.0% | 3.0% | 4.0% |
| Net Income (MM) | $1,595 | $1,810 | $1,379 | $1,772 | $2,709 | $4,340 |
| Net Interest Expense (MM) | -$224 | -$202 | -$402 | -$228 | -$169 | -$103 |
| Depreciation & Amort. (MM) | -$924 | -$941 | -$993 | -$976 | -$996 | -$1,028 |
| Earnings Per Share | $2.79 | $3.19 | $2.44 | $3.15 | $4.79 | $7.71 |
| EPS Growth | n/a | 14.34% | -23.51% | 29.1% | 52.06% | 60.96% |
| Diluted Shares (MM) | 572 | 567 | 565 | 563 | 566 | 563 |
| Free Cash Flow (MM) | -$5,112 | -$4,133 | -$4,917 | -$2,291 | $7,519 | $4,666 |
| Capital Expenditures (MM) | -$854 | -$651 | -$535 | -$95 | -$924 | -$1,188 |
| Net Current Assets (MM) | -$1,663 | -$1,200 | -$3,367 | -$2,337 | -$1,460 | $252 |
| Long Term Debt (MM) | $6,623 | $7,698 | $7,672 | $7,885 | $8,011 | $7,735 |
| Net Debt / EBITDA | 2.71 | 2.16 | 3.03 | 3.38 | 2.15 | 1.55 |
Archer-Daniels-Midland Company has weak revenue growth and a flat capital expenditure trend, weak operating margings with a positive growth rate, and just enough current assets to cover current liabilities. We also note that the company benefits from a strong EPS growth trend and healthy leverage. However, the firm suffers from slimmer gross margins than its peers and an unconvincing cash flow history.