Biotechnology company Seagen is standing out today, surging to $213.67 and marking a 3.5% change. In comparison the S&P 500 moved only 0.0%.
SGEN currently sits within range of its analyst target price of $224.83, which implies that its price may remain stable for the near future. Indeed, the average analayst rating for the stock is hold. Over the last year, Seagen shares have outperformed the S&P 500 by 34.0%, with a price change of 53.0%.
Seagen Inc., a biotechnology company, develops and commercializes therapies for the treatment of cancer in the United States and internationally. The company is categorized within the healthcare sector. The catalysts that drive valuations in this sector are complex. From demographics, regulations, scientific breakthroughs, to the emergence of new diseases, healthcare companies see their prices swing on the basis of a variety of factors.
Seagen does not publish either its forward or trailing P/E ratios because their values are negative -- meaning that each share of stock represents a net earnings loss. But we can calculate these P/E ratios anyways using the stocks forward and trailing (EPS) values of $-1.4 and $-3.86. We can see that SGEN has a forward P/E ratio of -152.6 and a trailing P/E ratio of -55.4.
The P/E ratio is the company's share price divided by its earnings per share. In other words, it represents how much investors are willing to spend for each dollar of the company's earnings (revenues minus the cost of goods sold, taxes, and overhead). As of the first quarter of 2023, the health care sector has an average P/E ratio of 24.45, and the average for the S&P 500 is 15.97.
The main limitation with P/E ratios is that they don't take into account the growth of earnings. This means that a company with a higher than average P/E ratio may still be undervalued if it has high projected earnings growth. Conversely, a company with a low P/E ratio may not present a good value proposition if its projected earnings are stagnant.
When we divide Seagen's P/E ratio by its projected 5 year earnings growth rate, we obtain its Price to Earnings Growth (PEG) ratio of 0.59. Since a PEG ratio of 1 or less may indicate that the company's valuation is proportionate to its growth potential, we see here that investors are undervaluing SGEN's growth potential .
To better understand the strength of Seagen's business, we can analyse its operating margins, which are its revenues minus its operating costs. Consistently strong margins backed by a positive trend can signal that a company is on track to deliver returns for its shareholders. Here's the operating margin statistics for the last four years:
| Date Reported | Total Revenue ($ k) | Operating Expenses ($ k) | Operating Margins (%) | YoY Growth (%) |
|---|---|---|---|---|
| 2023-02-15 | 1,962,412 | -2,165,324 | -31 | 27.91 |
| 2022-02-09 | 1,574,371 | -1,944,862 | -43 | -259.26 |
| 2021-02-12 | 2,175,536 | -1,360,964 | 27 | 212.5 |
| 2020-02-06 | 916,713 | -1,093,306 | -24 | 40.0 |
| 2019-02-07 | 654,700 | -826,405 | -40 | 2.44 |
| 2018-02-15 | 482,250 | -623,933 | -41 |
- Average operating margins: -25.3 %
- Average operating margins growth rate: 4.4 %
- Coefficient of variability (lower numbers indicate less volatility): 105.1 %
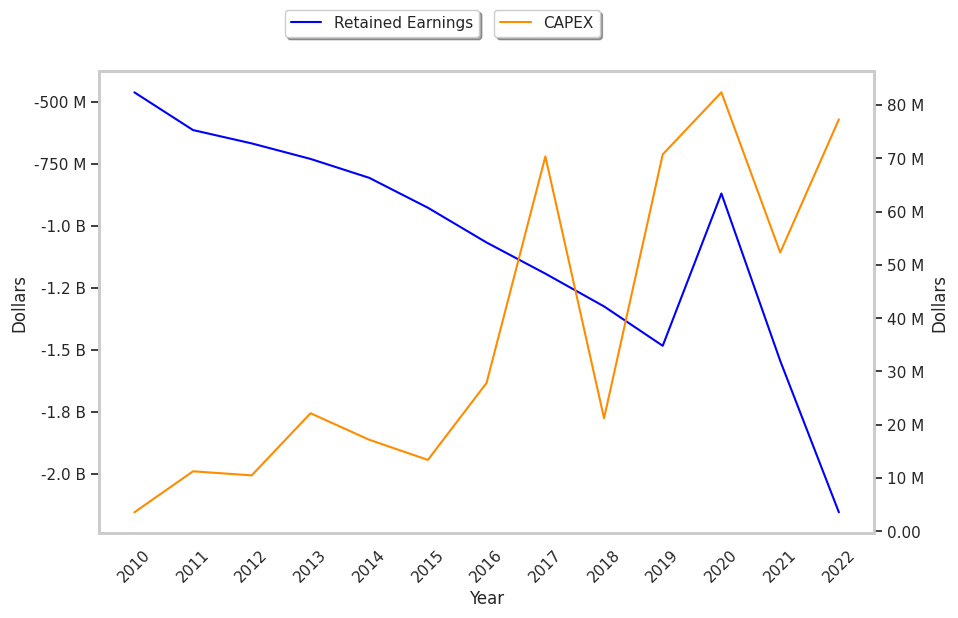
Another key to assessing a company's health is to look at its free cash flow, which is calculated on the basis of its total cash flow from operating activities minus its capital expenditures. Capital expenditures are the costs of maintaining fixed assets such as land, buildings, and equipment. From Seagen's last four annual reports, we are able to obtain the following rundown of its free cash flow:
| Date Reported | Cash Flow from Operations ($ k) | Capital expenditures ($ k) | Free Cash Flow ($ k) | YoY Growth (%) |
|---|---|---|---|---|
| 2023-02-15 | -453,751 | -77,340 | -376,411 | 15.73 |
| 2022-02-09 | -499,007 | -52,330 | -446,677 | -147.57 |
| 2021-02-12 | 856,568 | -82,409 | 938,977 | 1109.83 |
| 2020-02-06 | -163,737 | -70,753 | -92,984 | 49.0 |
| 2019-02-07 | -203,536 | -21,219 | -182,317 | -275.75 |
| 2018-02-15 | -118,900 | -70,379 | -48,521 |
- Average free cash flow: $-34655500.0
- Average free cash flown growth rate: -0.0 %
- Coefficient of variability (the lower the better): 400920756.4 %
If it weren't negative, the free cash flow would represent the amount of money available for reinvestment in the business, or for payments to equity investors in the form of a dividend. While a negative cash flow for one or two quarters is not a sign of financial troubles for SGEN, a long term trend of negative or highly erratic cash flow levels may indicate a struggling business or a mismanaged company.
Value investors often analyze stocks through the lens of its Price to Book (P/B) Ratio (market value divided by book value). The book value refers to the present value of the company if the company were to sell off all of its assets and pay all of its debts today - a number whose value may differ significantly depending on the accounting method.
Seagen's P/B ratio indicates that the market value of the company exceeds its book value by a factor of 15, so the company's assets may be overvalued compared to the average P/B ratio of the Health Care sector, which stands at 4.16 as of the first quarter of 2023.
Seagen is by most measures overvalued because it has a negative P/E ratio, an elevated P/B ratio, and an unconvincing cash flow history with a flat trend. The stock has poor growth indicators because it has a a negative PEG ratio and consistently negative margins with a stable trend. We hope you enjoyed this overview of SGEN's fundamentals.