Dow shares fell by -1.5% during the day's afternoon session, and are now trading at a price of $50.25. Is it time to buy the dip? To better answer that question, it's essential to check if the market is valuing the company's shares fairly in terms of its earnings and equity levels.
Dow's Valuation Is in Line With Its Sector Averages:
Dow Inc., through its subsidiaries, engages in the provision of various materials science solutions for packaging, infrastructure, mobility, and consumer applications in the United States, Canada, Europe, the Middle East, Africa, India, the Asia Pacific, and Latin America. The company belongs to the Industrials sector, which has an average price to earnings (P/E) ratio of 20.49 and an average price to book (P/B) ratio of 3.78. In contrast, Dow has a trailing 12 month P/E ratio of 21.1 and a P/B ratio of 1.77.
When we divide Dow's P/E ratio by its expected EPS growth rate of the next five years, we obtain its PEG ratio of -2.81. Since it's negative, the company has negative growth expectations, and most investors will probably avoid the stock unless it has an exceptionally low P/E and P/B ratio.
The Company Enjoys Exceptional EPS Growth:
| 2020-02-07 | 2021-02-05 | 2022-02-04 | 2023-02-01 | |
|---|---|---|---|---|
| Revenue (MM) | $42,951 | $38,542 | $54,968 | $56,902 |
| Gross Margins | 15.0% | 13.0% | 20.0% | 15.0% |
| Operating Margins | 8% | 7% | 14% | 10% |
| Net Margins | -3.0% | 3.0% | 11.0% | 8.0% |
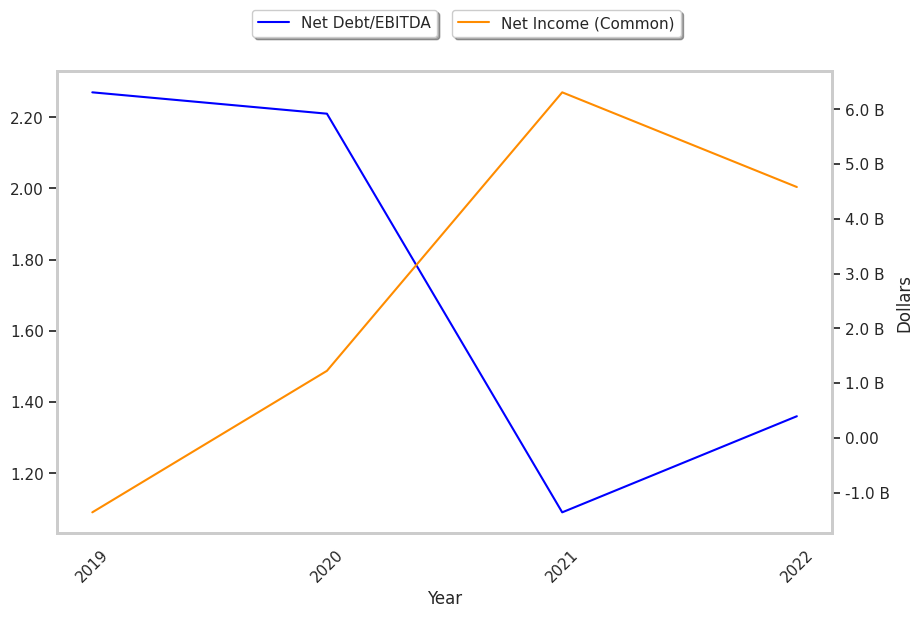
| Net Income (MM) | -$1,359 | $1,225 | $6,311 | $4,582 |
| Net Interest Expense (MM) | -$852 | -$789 | -$676 | -$489 |
| Depreciation & Amort. (MM) | -$2,938 | -$2,874 | -$2,842 | -$2,758 |
| Earnings Per Share | -$1.83 | $1.65 | $8.41 | $6.31 |
| EPS Growth | n/a | 190.16% | 409.7% | -24.97% |
| Diluted Shares (MM) | 742 | 742 | 750 | 726 |
| Free Cash Flow (MM) | $7,967 | $7,520 | $8,793 | $9,532 |
| Capital Expenditures (MM) | -$2,037 | -$1,257 | -$1,593 | -$2,013 |
| Net Current Assets (MM) | -$29,615 | -$29,381 | -$21,358 | -$17,290 |
| Long Term Debt (MM) | $15,975 | $16,491 | $14,280 | $14,698 |
| Net Debt / EBITDA | 2.27 | 2.21 | 1.09 | 1.36 |
Dow has weak revenue growth and a flat capital expenditure trend, irregular cash flows, and a decent current ratio. We also note that the company benefits from exceptional EPS growth and healthy leverage. However, the firm suffers from slimmer gross margins than its peers and weak operating margins with a positive growth rate.