We've been asking ourselves recently if the market has placed a fair valuation on Freeport-McMoRan. Let's dive into some of the fundamental values of this large-cap Basic Materials company to determine if there might be an opportunity here for value-minded investors.
Freeport-McMoRan Has Elevated P/B and P/E Ratios:
Freeport-McMoRan Inc. engages in the mining of mineral properties in North America, South America, and Indonesia. The company belongs to the Basic Materials sector, which has an average price to earnings (P/E) ratio of 10.03 and an average price to book (P/B) ratio of 2.08. In contrast, Freeport-McMoRan has a trailing 12 month P/E ratio of 25.3 and a P/B ratio of 3.29.
When we divide Freeport-McMoRan's P/E ratio by its expected EPS growth rate of the next five years, we obtain its PEG ratio of -1.46. Since it's negative, the company has negative growth expectations, and most investors will probably avoid the stock unless it has an exceptionally low P/E and P/B ratio.
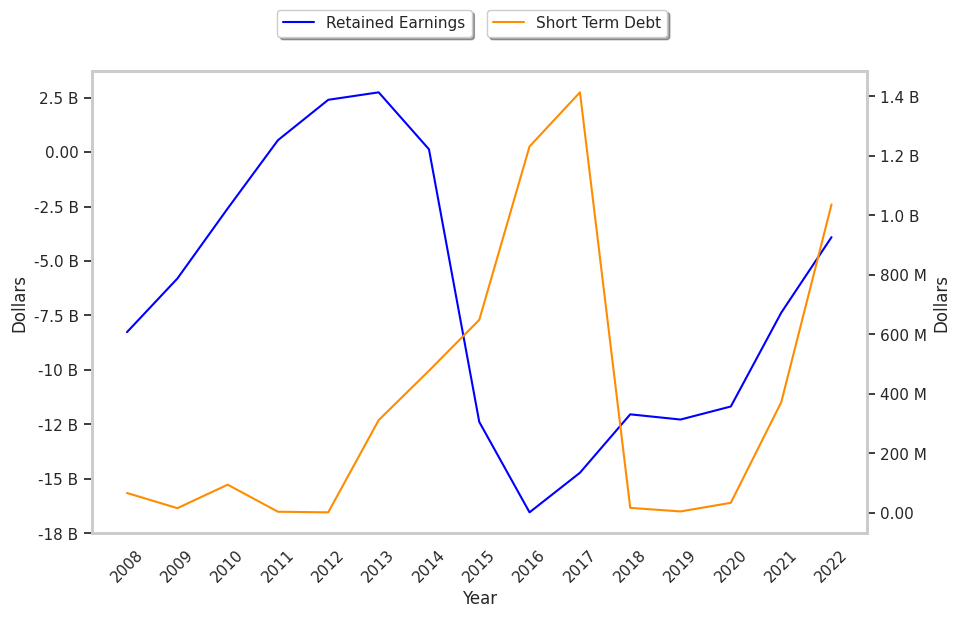
The Business Runs With Low Leverage Levels:
| 2018-02-20 | 2019-02-15 | 2020-02-14 | 2021-02-16 | 2022-02-15 | 2023-02-15 | |
|---|---|---|---|---|---|---|
| Revenue (MM) | $16,403 | $18,628 | $14,402 | $14,198 | $22,845 | $22,780 |
| Operating Margins | 23% | 25% | 5% | 15% | 37% | 31% |
| Net Margins | 11.0% | 14.0% | -2.0% | 4.0% | 19.0% | 15.0% |
| Net Income (MM) | $1,817 | $2,602 | -$239 | $599 | $4,306 | $3,468 |
| Net Interest Expense (MM) | -$801 | -$945 | -$620 | -$598 | -$602 | -$560 |
| Depreciation & Amort. (MM) | -$1,714 | -$1,754 | -$1,412 | -$1,528 | -$1,998 | -$2,019 |
| Earnings Per Share | $1.25 | $1.78 | -$0.16 | $0.41 | $2.91 | $2.39 |
| EPS Growth | n/a | 42.4% | -108.99% | 356.25% | 609.76% | -17.87% |
| Diluted Shares (MM) | 1,454 | 1,458 | 1,451 | 1,461 | 1,482 | 1,451 |
| Free Cash Flow (MM) | $6,076 | $5,834 | $2,073 | $3,048 | $8,200 | $6,771 |
| Capital Expenditures (MM) | -$1,410 | -$1,971 | -$591 | -$31 | -$485 | -$1,632 |
| Net Current Assets (MM) | -$15,380 | -$13,604 | -$15,446 | -$14,173 | -$10,173 | -$10,609 |
| Long Term Debt (MM) | $11,815 | $11,124 | $9,821 | $9,677 | $9,078 | $9,583 |
| Net Debt / EBITDA | 1.56 | 1.08 | 3.56 | 1.66 | 0.13 | 0.27 |
Freeport-McMoRan has an excellent current ratio, low leverage, and positive EPS growth. Furthermore, Freeport-McMoRan has weak revenue growth and a flat capital expenditure trend, average net margins with a positive growth rate, and irregular cash flows.