General Mills does not have the profile of a defensive investment based on the requirements of Ben Graham. The Packaged Foods firm may nonetheless be of interest to more risk-oriented investors who have a solid thesis on the company's future growth. At Market Inference, we remain agnostic as to such further developments, and prefer to use a company's past track record as the bellwether for future potential gains.
General Mills Is Probably Overvalued
Graham devised the below equation to give investors a quick way of determining whether a stock is trading at a fair multiple of its earnings and its assets:
√(22.5 * 6 year average earnings per share (3.5) * 6 year average book value per share (17.523) = $41.39
At today's price of $64.82 per share, General Mills is now trading 56.6% above the maximum price that Graham would have wanted to pay for the stock.
Even though the stock does not trade at an attractive multiple, it might still meet some of the other criteria for quality stocks that Graham listed in Chapter 14 of The Intelligent Investor.
Impressive Revenues, Consistent Profitability, and a Growing Dividend Imply Value
General Mills’s average sales revenue over the last 6 years has been $28.81 Billion, so by Graham’s standards the stock has sufficient revenues to make it worthy of investment. When published in 1972, Graham’s threshold was $100 million in average sales, which would be the equivalent of around a half million dollars today.
Ben Graham believed that a margin of safety could be obtained by investing only in companies with consistently positive retained earnings. Retained earnings represent the cumulative net earnings or (deficit) left to equity holders after dividends have been paid out. General Mills had positive retained earnings from 2009 to 2023 with an average of $13.04 Billion over this period.
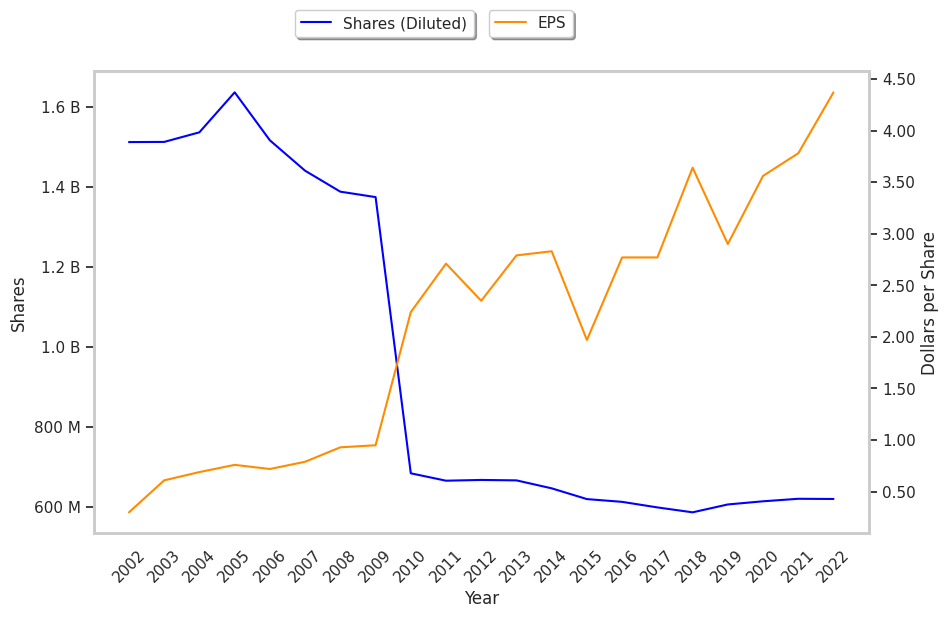
Ben Graham would also require a cumulative growth of Earnings Per Share of at least 30% over the last ten years.To determine General Mills's EPS growth over time, we will average out its EPS for 2008, 2009, and 2010, which were $1.85, $0.83, and $0.92 respectively. This gives us an average of $1.20 for the period of 2008 to 2010. Next, we compare this value with the average EPS reported in 2021, 2022, and 2023, which were $0.97, $1.01, and $4.31, for an average of $2.10. Now we see that General Mills's EPS growth was 75.0% during this period, which satisfies Ben Graham's requirement.
Negative Current Asset to Liabilities Balance and Not Enough Current Assets to Cover Current Liabilities
Graham sought companies with extremely low debt levels compared to their assets. For one, he expected their current ratio to be over 2 and their long term debt to net current asset ratio to be near, or ideally under, under 1. General Mills fails on both counts with a current ratio of 0.6 and a debt to net current asset ratio of -0.6.
Conclusion
According to Graham's analysis, General Mills is likely a company of average quality, which does not offer a significant enough margin of safety for a risk averse investor.
| 2017-06-29 | 2018-06-29 | 2019-06-28 | 2020-07-02 | 2021-06-30 | 2022-06-29 | |
|---|---|---|---|---|---|---|
| Revenue (MM) | $15,620 | $15,740 | $16,865 | $17,627 | $18,127 | $18,993 |
| Gross Margins | 36.0% | 34.0% | 34.0% | 35.0% | 36.0% | 34.0% |
| Operating Margins | 18% | 17% | 17% | 17% | 19% | 17% |
| Net Margins | 11.0% | 14.0% | 10.0% | 12.0% | 13.0% | 14.0% |
| Net Income (MM) | $1,658 | $2,131 | $1,753 | $2,181 | $2,340 | $2,707 |
| Net Interest Expense (MM) | -$295 | -$374 | -$522 | -$466 | -$420 | -$380 |
| Depreciation & Amort. (MM) | -$604 | -$619 | -$620 | -$595 | -$601 | -$570 |
| Earnings Per Share | $2.77 | $3.64 | $2.9 | $3.56 | $3.78 | $4.37 |
| EPS Growth | n/a | 31.41% | -20.33% | 22.76% | 6.18% | 15.61% |
| Diluted Shares (MM) | 598 | 586 | 605 | 613 | 620 | 619 |
| Free Cash Flow (MM) | $3,095 | $3,462 | $3,330 | $4,135 | $3,511 | $3,882 |
| Capital Expenditures (MM) | -$680 | -$621 | -$523 | -$459 | -$528 | -$565 |
| Net Current Assets (MM) | -$13,066 | -$20,008 | -$18,557 | -$17,336 | -$16,314 | -$15,212 |
| Long Term Debt (MM) | $7,643 | $12,669 | $11,625 | $10,929 | $9,787 | $9,135 |
| Net Debt / EBITDA | 2.59 | 4.68 | 4.08 | 3.32 | 2.8 | 2.89 |