Alexandria Real Estate Equities logged a -0.9% change during today's morning session, and is now trading at a price of $100.39 per share.
Alexandria Real Estate Equities returned losses of -27.0% last year, with its stock price reaching a high of $172.65 and a low of $100.31. Over the same period, the stock underperformed the S&P 500 index by -46.0%. As of April 2023, the company's 50-day average price was $117.67. Alexandria Real Estate Equities, Inc. (NYSE: ARE), an S&P 500 company, is a best-in-class, mission-driven life science REIT making a positive and lasting impact on the world. Based in Pasadena, CA, the large-cap Real Estate company has 593 full time employees. Alexandria Real Estate Equities has offered a 4.8% dividend yield over the last 12 months.
The Company May Be Profitable, but Its Balance Sheet Is Highly Leveraged:
| 2018-01-30 | 2019-02-05 | 2020-02-04 | 2021-02-01 | 2022-01-31 | 2023-01-30 | |
|---|---|---|---|---|---|---|
| Revenue (MM) | $1,128 | $1,327 | $1,531 | $1,886 | $2,114 | $2,589 |
| Operating Margins | 28% | 28% | 28% | 28% | 25% | 24% |
| Net Margins | 15.0% | 28.0% | 24.0% | 41.0% | 27.0% | 20.0% |
| Net Income (MM) | $169 | $379 | $363 | $771 | $571 | $522 |
| Net Interest Expense (MM) | -$129 | -$157 | -$174 | -$172 | -$142 | -$94 |
| Depreciation & Amort. (MM) | -$417 | -$478 | -$545 | -$698 | -$821 | -$1,002 |
| Earnings Per Share | $1.58 | $3.52 | $3.12 | $6.18 | $3.82 | $3.28 |
| EPS Growth | n/a | 122.78% | -11.36% | 98.08% | -38.19% | -14.14% |
| Diluted Shares (MM) | 92 | 103 | 113 | 126 | 152 | 162 |
| Free Cash Flow (MM) | $1,329 | $2,448 | $4,162 | $4,151 | $8,344 | $6,485 |
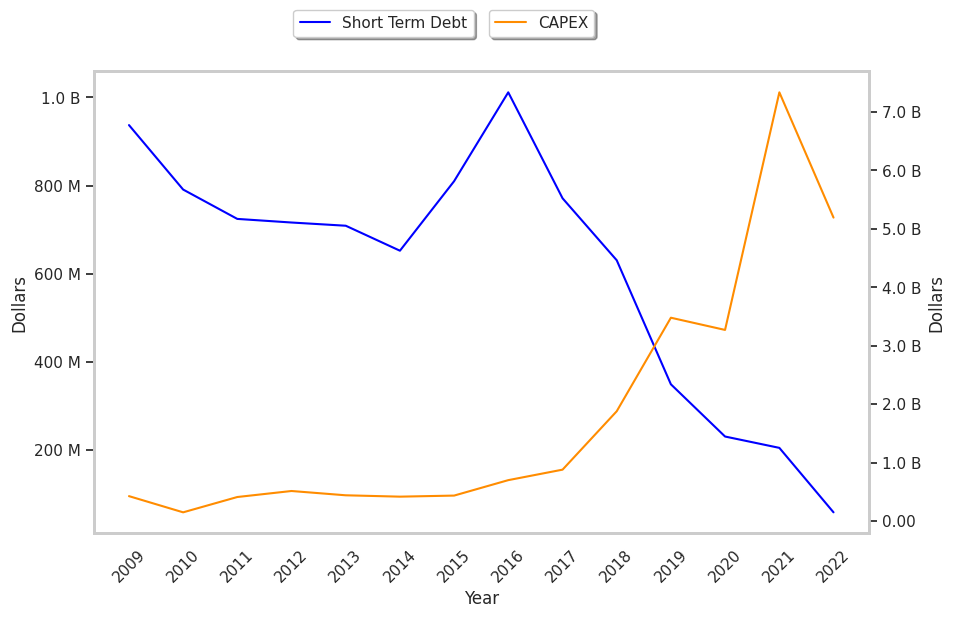
| Capital Expenditures (MM) | -$878 | -$1,878 | -$3,478 | -$3,269 | -$7,334 | -$5,191 |
| Net Current Assets (MM) | -$5,333 | -$6,288 | -$7,624 | -$8,779 | -$10,764 | -$11,975 |
| Long Term Debt (MM) | $3,994 | $4,848 | $6,428 | $7,332 | $8,587 | $10,101 |
| Net Debt / EBITDA | 6.2 | 6.13 | 6.39 | 5.72 | 6.3 | 5.73 |
Alexandria Real Estate Equities Is Fairly Priced at Current Levels:
Alexandria Real Estate Equities has a trailing twelve month P/E ratio of 34.7, compared to an average of 24.81 for the Real Estate sector. Based on its EPS guidance of $3.81, the company has a forward P/E ratio of 30.9. Alexandria Real Estate Equities's PEG ratio is 3.71 on the basis of the 9.3% weighted average of the company and the broader market's EPS compound average growth rates. This suggests that the company's shares are overvalued. In contrast, the market is likely undervaluing Alexandria Real Estate Equities in terms of its equity because its P/B ratio is 0.92 while the sector average is 2.24. The company's shares are currently trading -1.3% below their Graham number.
Alexandria Real Estate Equities Has an Analyst Consensus of Strong Upside Potential:
The 9 analysts following Alexandria Real Estate Equities have set target prices ranging from $137.0 to $186.0 per share, for an average of $154.89 with a buy rating. As of April 2023, the company is trading -24.0% away from its average target price, indicating that there is an analyst consensus of strong upside potential.
Alexandria Real Estate Equities has an average amount of shares sold short because 2.9% of the company's shares are sold short. Institutions own 96.5% of the company's shares, and the insider ownership rate stands at 0.92%, suggesting a small amount of insider investors. The largest shareholder is Vanguard Group Inc, whose 16% stake in the company is worth $2,711,566,711.