HP shares fell by -1.7% during the day's afternoon session, and are now trading at a price of $26.3. Is it time to buy the dip? To better answer that question, it's essential to check if the market is valuing the company's shares fairly in terms of its earnings and equity levels.
HP Is Fairly Valued:
HP Inc. provides personal computing and other access devices, imaging and printing products, and related technologies, solutions, and services in the United States and internationally. The company belongs to the Technology sector, which has an average price to earnings (P/E) ratio of 27.16. In contrast, HP has a trailing 12 month P/E ratio of 11.3 based on its earnings per share of $2.33.
There is an important limit on the usefulness of P/E ratios. Since the P/E ratio is the share price divided by earnings per share, the ratio is determined partially by market sentiment on the stock. Sometimes a negative sentiment translates to a lower market price and therefore a lower P/E ratio -- and there might be good reasons for this negative sentiment.
One of the main reasons not to blindly invest in a company with a low P/E ratio is that it might have low growth expectations. Low growth correlates with low stock performance, so it's useful to factor growth into the valuation process. One of the easiest ways to do this is to divide the company's P/E ratio by its expected growth rate, which results in the price to earnings growth, or PEG ratio.
HP's PEG ratio is -4.8, which indicates that the market is undervaluing the company's projected growth (a PEG ratio of 1 indicates a fairly valued company). Your analysis of the stock shouldn't end here. Rather, a good PEG ratio should alert you that it may be worthwhile to take a closer look at the stock.
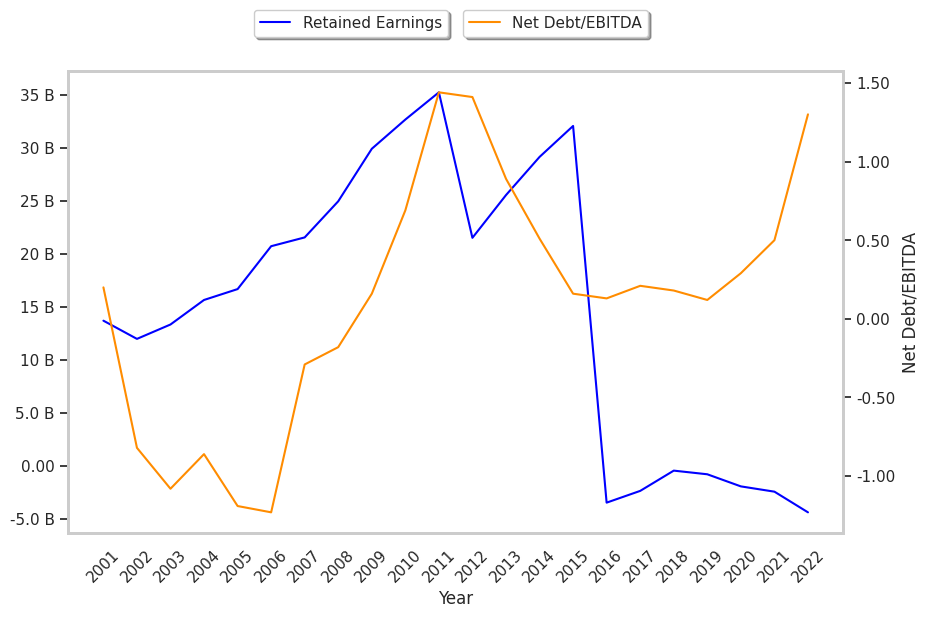
EPS Trend Sustained Primarily by Reducing the Number of Shares Outstanding:
| 2017-12-14 | 2018-12-13 | 2020-02-27 | 2020-12-10 | 2021-12-09 | 2022-12-06 | |
|---|---|---|---|---|---|---|
| Revenue (MM) | $52,056 | $58,472 | $58,756 | $56,639 | $63,487 | $62,983 |
| Gross Margins | 18.0% | 18.0% | 19.0% | 18.0% | 21.0% | 20.0% |
| Operating Margins | 7% | 7% | 7% | 7% | 9% | 8% |
| Net Margins | 5.0% | 9.0% | 5.0% | 5.0% | 10.0% | 5.0% |
| Net Income (MM) | $2,526 | $5,327 | $3,152 | $2,844 | $6,503 | $3,203 |
| Earnings Per Share | $1.48 | $3.26 | $2.07 | $2.0 | $5.94 | $3.05 |
| EPS Growth | n/a | 120.27% | -36.5% | -3.38% | 197.0% | -48.65% |
| Diluted Shares (MM) | 1,702 | 1,634 | 1,524 | 1,420 | 1,094 | 1,050 |
| Free Cash Flow (MM) | $4,010 | $4,902 | $5,325 | $4,893 | $6,991 | $5,228 |
| Capital Expenditures (MM) | -$333 | -$374 | -$671 | -$577 | -$582 | -$765 |
| Net Current Assets (MM) | -$14,003 | -$13,874 | -$14,483 | -$16,261 | -$18,090 | -$21,704 |
| Long Term Debt (MM) | $6,747 | $4,524 | $4,780 | $5,543 | $6,386 | $10,796 |
| Net Debt / EBITDA | 0.21 | 0.18 | 0.12 | 0.29 | 0.5 | 1.3 |
HP has weak revenue growth and a flat capital expenditure trend, weak operating margings with a stable trend, and irregular cash flows. We also note that the company has healthy leverage working in its favor. However, the firm suffers from slimmer gross margins than its peers and EPS growth achieved by reducing the number of outstanding shares.