AT&T logged a -0.9% change during today's morning session, and is now trading at a price of $14.99 per share.
Over the last year, AT&T logged a -1.0% change, with its stock price reaching a high of $21.53 and a low of $13.43. Over the same period, the stock underperformed the S&P 500 index by -20.0%. As of April 2023, the company's 50-day average price was $14.48. AT&T Inc. provides telecommunications and technology services worldwide. Based in Dallas, TX, the large-cap Telecommunications company has 160,700 full time employees. AT&T has offered a 7.3% dividend yield over the last 12 months.
The Company May Be Profitable, but Its Balance Sheet Is Highly Leveraged:
| 2018-02-20 | 2019-02-20 | 2020-02-20 | 2021-02-25 | 2022-02-16 | 2023-02-13 | |
|---|---|---|---|---|---|---|
| Revenue (MM) | $160,546 | $170,756 | $181,193 | $143,050 | $134,038 | $120,741 |
| Gross Margins | 52.0% | 53.0% | 54.0% | 54.0% | 55.0% | 57.0% |
| Operating Margins | 14% | 15% | 16% | 17% | 19% | 19% |
| Net Margins | 18.0% | 11.0% | 8.0% | -4.0% | 15.0% | -7.0% |
| Net Income (MM) | $29,450 | $19,370 | $13,903 | -$5,176 | $20,081 | -$8,524 |
| Net Interest Expense (MM) | -$6,300 | -$7,957 | -$8,422 | -$7,727 | -$6,716 | -$6,108 |
| Depreciation & Amort. (MM) | -$24,387 | -$28,430 | -$28,217 | -$22,523 | -$17,852 | -$18,021 |
| Earnings Per Share | $4.76 | $2.85 | $1.89 | -$0.75 | $2.76 | -$1.21 |
| EPS Growth | n/a | -40.13% | -33.68% | -139.68% | 468.0% | -143.84% |
| Diluted Shares (MM) | 6,183 | 6,806 | 7,348 | 7,183 | 7,204 | 7,199 |
| Free Cash Flow (MM) | $58,657 | $64,853 | $63,619 | $49,702 | $45,579 | $55,239 |
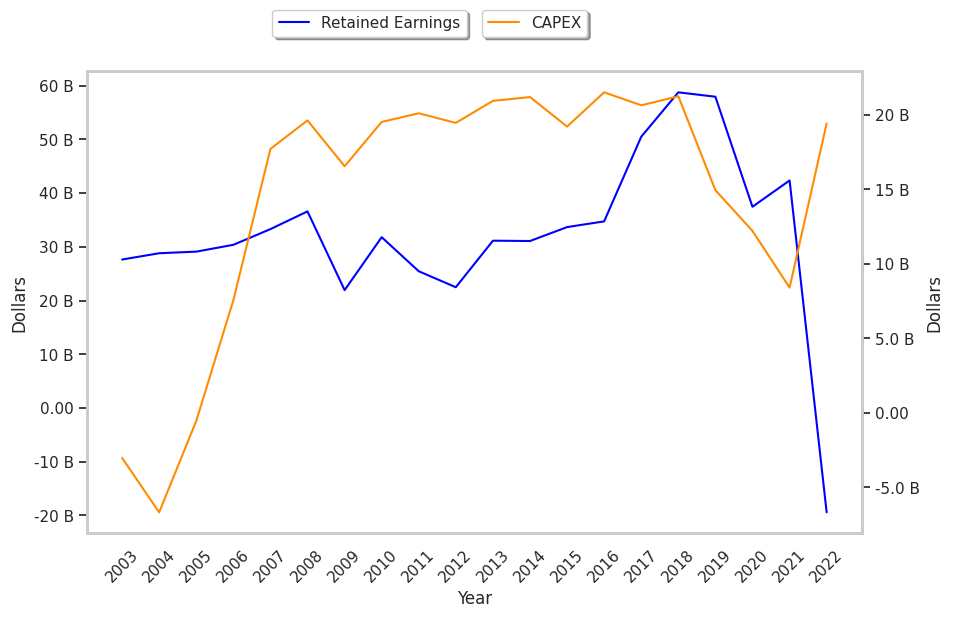
| Capital Expenditures (MM) | -$20,647 | -$21,251 | -$14,951 | -$12,218 | -$8,409 | -$19,427 |
| Net Current Assets (MM) | -$222,944 | -$286,553 | -$294,974 | -$294,513 | -$196,999 | -$263,288 |
| Long Term Debt (MM) | $125,972 | $166,250 | $151,309 | $153,775 | $151,011 | $128,423 |
| Net Debt / EBITDA | 2.41 | 3.14 | 2.62 | 3.17 | 3.56 | 3.23 |
AT&T has slimmer gross margins than its peers, declining EPS growth, and a highly leveraged balance sheet. On the other hand, the company has average operating margins with a positive growth rate working in its favor. Furthermore, AT&T has weak revenue growth and a flat capital expenditure trend and irregular cash flows.
AT&T does not have a meaningful trailing P/E ratio since its earnings per share are currently in the red. Based on its EPS guidance of $2.32, the company has a forward P/E ratio of 6.2. In comparison, the average P/E ratio for the Telecommunications sector is 18.85. On the other hand, the market is undervaluing AT&T in terms of its equity because its P/B ratio is 1.05. In comparison, the sector average is 3.12.
There's an Analyst Consensus of Some Upside Potential for AT&T:
The 20 analysts following AT&T have set target prices ranging from $7.5 to $23.42 per share, for an average of $17.12 with a hold rating. As of April 2023, the company is trading -15.4% away from its average target price, indicating that there is an analyst consensus of some upside potential.
AT&T has a very low short interest because 1.6% of the company's shares are sold short. Institutions own 56.7% of the company's shares, and the insider ownership rate stands at 0.09%, suggesting a small amount of insider investors. The largest shareholder is Vanguard Group Inc, whose 9% stake in the company is worth $9,298,258,588.