Based on the factors that Benjamin Graham considered in analyzing potential stock picks, Apple is not a quality investment. Only investors with a high risk tolerance and a solid investment thesis on the stock will be interested in this large-cap Computer Hardware company.
Apple Is Probably Overvalued
Graham devised the below equation to give investors a quick way of determining whether a stock is trading at a fair multiple of its earnings and its assets:
√(22.5 * 6 year average earnings per share (3.89) * 6 year average book value per share (3.852) = $20.66
After an impressive 22.0% performance over the 12 months, Apple is now trading well over its fair value because its Graham number is 737.9% above today's share price of $173.12. Even though the stock does not trade at an attractive multiple, it might still meet some of the other criteria for quality stocks that Graham listed in Chapter 14 of The Intelligent Investor.
A Decent Record of Dividends and EPS Growth In Excess Of Graham'S Requirements
Another one of Graham's requirements is for a 30% or more cumulative growth rate of the company's earnings per share over the last ten years.To determine Apple's EPS growth over time, we will average out its EPS for 2007, 2008, and 2009, which were $3.93, $2.50, and $3.67 respectively. This gives us an average of $3.37 for the period of 2007 to 2009. Next, we compare this value with the average EPS reported in 2020, 2021, and 2022, which were $3.28, $5.61, and $6.11, for an average of $5.00. Now we see that Apple's EPS growth was 48.37% during this period, which satisfies Ben Graham's requirement.
Apple has offered a regular dividend since at least 2012. The company has returned an average dividend yield of 0.8% over the last five years.
Negative Current Asset to Liabilities Balance and Not Enough Current Assets to Cover Current Liabilities
Graham sought companies with extremely low debt levels compared to their assets. For one, he expected their current ratio to be over 2 and their long term debt to net current asset ratio to be near, or ideally under, under 1. Apple fails on both counts with a current ratio of 1.0 and a debt to net current asset ratio of -0.7.
According to Graham's analysis, Apple is likely a company of low quality, which is trading far above its fair price.
| 2017-11-03 | 2018-11-05 | 2019-10-31 | 2020-10-30 | 2021-10-29 | 2022-10-28 | |
|---|---|---|---|---|---|---|
| Revenue (MM) | $229,234 | $265,595 | $260,174 | $274,515 | $365,817 | $394,328 |
| Gross Margins | 38.0% | 38.0% | 38.0% | 38.0% | 42.0% | 43.0% |
| Operating Margins | 27% | 27% | 25% | 24% | 30% | 30% |
| Net Margins | 21.0% | 22.0% | 21.0% | 21.0% | 26.0% | 25.0% |
| Net Income (MM) | $48,351 | $59,531 | $55,256 | $57,411 | $94,680 | $99,803 |
| Earnings Per Share | $2.3 | $2.98 | $2.97 | $3.28 | $5.73 | $6.11 |
| EPS Growth | n/a | 29.57% | -0.34% | 10.44% | 74.7% | 6.63% |
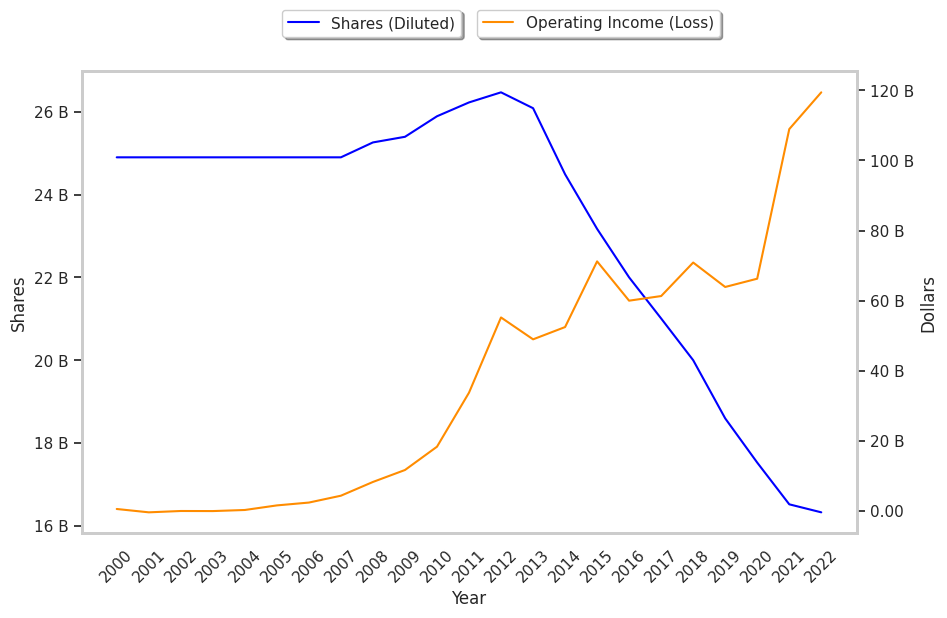
| Diluted Shares (MM) | 21,007 | 20,000 | 18,596 | 17,528 | 16,519 | 16,326 |
| Free Cash Flow (MM) | $76,676 | $90,747 | $79,886 | $87,983 | $115,123 | $132,859 |
| Capital Expenditures (MM) | -$12,451 | -$13,313 | -$10,495 | -$7,309 | -$11,085 | -$10,708 |
| Net Current Assets (MM) | -$112,627 | -$127,239 | -$85,209 | -$114,836 | -$153,076 | -$166,678 |
| Long Term Debt (MM) | $97,207 | $93,735 | $91,807 | $98,667 | $118,719 | $110,087 |
| Net Debt / EBITDA | 0.58 | 0.59 | 0.1 | 0.28 | 0.52 | 0.55 |