Cisco Systems does not have the profile of a defensive investment based on the requirements of Ben Graham. The Communication Equipment firm may nonetheless be of interest to more risk-oriented investors who have a solid thesis on the company's future growth. At Market Inference, we remain agnostic as to such further developments, and prefer to use a company's past track record as the bellwether for future potential gains.
Cisco Systems Is Probably Overvalued
Graham devised the below equation to give investors a quick way of determining whether a stock is trading at a fair multiple of its earnings and its assets:
√(22.5 * 6 year average earnings per share (2.08) * 6 year average book value per share (10.908) = $24.54
After an impressive 33.0% performance over the 12 months, Cisco Systems is now trading well over its fair value because its Graham number is 120.4% above today's share price of $54.09. Even though the stock does not trade at an attractive multiple, it might still meet some of the other criteria for quality stocks that Graham listed in Chapter 14 of The Intelligent Investor.
Negative Retained Earnings In 2019, 2020, And 2021, A Solid Record Of Dividends, and Eps Growth In Excess Of Graham'S Requirements
Ben Graham wrote that an investment in a company with a record of positive retained earnings could contribute significantly to the margin of safety. However, Cisco Systems had negative retained earnings in 2019, 2020, and 2021 with an average of $7.4 Billion over this period.
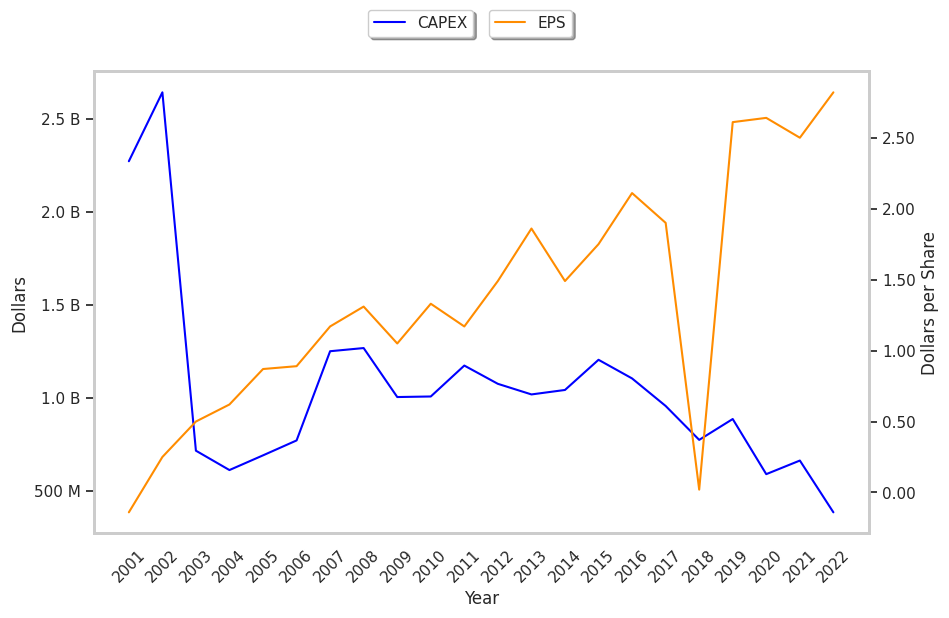
Another one of Graham's requirements is for a 30% or more cumulative growth rate of the company's earnings per share over the last ten years.To determine Cisco Systems's EPS growth over time, we will average out its EPS for 2008, 2009, and 2010, which were $0.37, $0.30, and $0.34 respectively. This gives us an average of $0.34 for the period of 2008 to 2010. Next, we compare this value with the average EPS reported in 2021, 2022, and 2023, which were $2.50, $2.82, and $3.07, for an average of $2.80. Now we see that Cisco Systems's EPS growth was 723.53% during this period, which satisfies Ben Graham's requirement.
Cisco Systems has offered a regular dividend since at least 2011. The company has returned an average dividend yield of 3.0% over the last five years.
Negative Current Asset to Liabilities Balance and an Average Current Ratio
Graham sought companies with extremely low debt levels compared to their assets. For one, he expected their current ratio to be over 2 and their long term debt to net current asset ratio to be near, or ideally under, under 1. Cisco Systems fails on both counts with a current ratio of 1.4 and a debt to net current asset ratio of -0.5.
Conclusion
According to Graham's analysis, Cisco Systems is likely a company of average quality, which does not offer a significant enough margin of safety for a risk averse investor.
| 2017-09-07 | 2018-09-06 | 2019-09-05 | 2020-09-03 | 2021-09-09 | 2022-09-08 | |
|---|---|---|---|---|---|---|
| Revenue (MM) | $48,005 | $49,330 | $51,904 | $49,301 | $49,818 | $51,557 |
| Gross Margins | 63.0% | 62.0% | 63.0% | 64.0% | 64.0% | 63.0% |
| Operating Margins | 25% | 25% | 27% | 28% | 26% | 27% |
| Net Margins | 20.0% | 0.0% | 22.0% | 23.0% | 21.0% | 23.0% |
| Net Income (MM) | $9,609 | $110 | $11,621 | $11,214 | $10,591 | $11,812 |
| Net Interest Expense (MM) | $477 | $565 | $449 | $335 | $184 | $116 |
| Depreciation & Amort. (MM) | -$2,286 | -$2,192 | -$1,897 | -$1,808 | -$1,862 | -$1,957 |
| Earnings Per Share | $1.9 | $0.02 | $2.61 | $2.64 | $2.5 | $2.82 |
| EPS Growth | n/a | -98.95% | 12950.0% | 1.15% | -5.3% | 12.8% |
| Diluted Shares (MM) | 5,049 | 4,881 | 4,453 | 4,254 | 4,236 | 4,192 |
| Free Cash Flow (MM) | $14,833 | $14,441 | $16,718 | $16,017 | $16,118 | $13,612 |
| Capital Expenditures (MM) | -$957 | -$775 | -$887 | -$591 | -$664 | -$386 |
| Net Current Assets (MM) | $20,022 | -$3,743 | -$16,467 | -$13,360 | -$17,110 | -$17,512 |
| Long Term Debt (MM) | $25,725 | $20,331 | $14,475 | $11,578 | $9,018 | $8,416 |
| Net Debt / EBITDA | -2.58 | -1.45 | -0.54 | -0.96 | -0.88 | -0.61 |