Dollar Tree shares fell by -1.7% during the day's afternoon session, and are now trading at a price of $104.59. Is it time to buy the dip? To better answer that question, it's essential to check if the market is valuing the company's shares fairly in terms of its earnings and equity levels.
Dollar Tree's Valuation Is in Line With Its Sector Averages:
Dollar Tree, Inc. operates discount variety retail stores. The company belongs to the Consumer Discretionary sector, which has an average price to earnings (P/E) ratio of 22.33 and an average price to book (P/B) ratio of 3.12. In contrast, Dollar Tree has a trailing 12 month P/E ratio of 19.1 and a P/B ratio of 2.55.
When we divideDollar Tree's P/E ratio by its expected five-year EPS growth rate, we obtain a PEG ratio of 0.91, which indicates that the market is undervaluing the company's projected growth (a PEG ratio of 1 indicates a fairly valued company). Your analysis of the stock shouldn't end here. Rather, a good PEG ratio should alert you that it may be worthwhile to take a closer look at the stock.
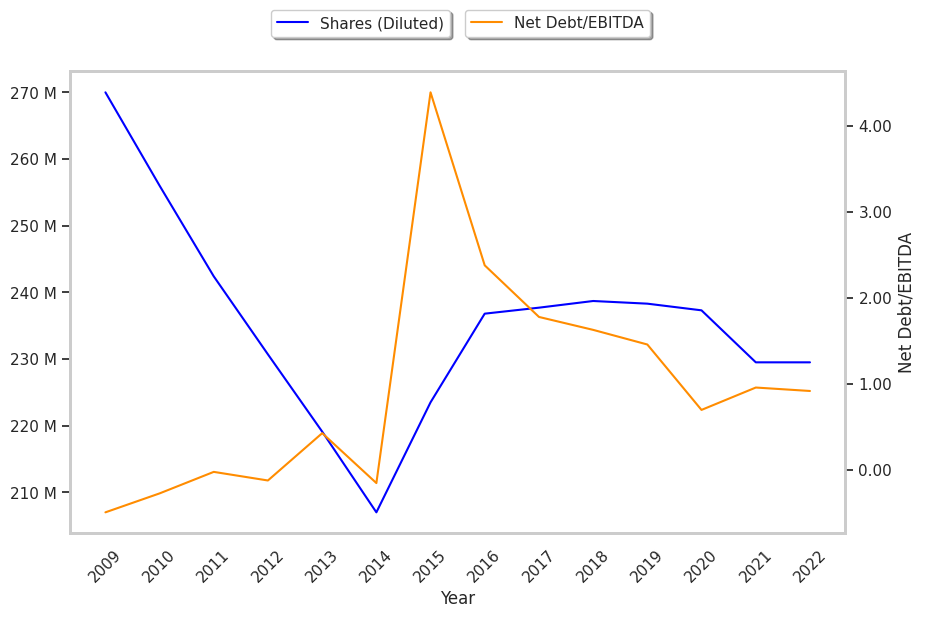
Healthy Debt Levels but a Declining EPS Growth Trend:
| 2018-03-16 | 2019-03-27 | 2020-03-20 | 2021-03-16 | 2022-03-15 | 2023-03-10 | |
|---|---|---|---|---|---|---|
| Revenue (MM) | $22,246 | $22,823 | $23,611 | $25,509 | $26,321 | $28,332 |
| Gross Margins | 32.0% | 30.0% | 30.0% | 31.0% | 28.0% | 32.0% |
| Operating Margins | 9% | 8% | 7% | 7% | 7% | 8% |
| Net Margins | 8.0% | -7.0% | 4.0% | 5.0% | 5.0% | 6.0% |
| Net Income (MM) | $1,714 | -$1,591 | $827 | $1,342 | $1,328 | $1,615 |
| Net Interest Expense (MM) | -$302 | -$370 | -$162 | -$147 | -$179 | -$125 |
| Depreciation & Amort. (MM) | -$611 | -$621 | -$645 | -$687 | -$716 | -$768 |
| Earnings Per Share | $7.21 | -$6.66 | $3.47 | $5.65 | $5.79 | $7.04 |
| EPS Growth | n/a | -192.37% | 152.1% | 62.82% | 2.48% | 21.59% |
| Diluted Shares (MM) | 238 | 239 | 238 | 237 | 230 | 230 |
| Free Cash Flow (MM) | $2,142 | $2,583 | $2,890 | $3,606 | $2,451 | $2,869 |
| Capital Expenditures (MM) | -$632 | -$817 | -$1,020 | -$890 | -$1,020 | -$1,254 |
| Net Current Assets (MM) | -$4,574 | -$3,565 | -$9,050 | -$8,360 | -$8,394 | -$7,904 |
| Long Term Debt (MM) | $4,862 | $4,344 | $3,522 | $3,226 | $3,417 | $3,422 |
Dollar Tree has strong margins with a stable trend, healthy debt levels, and wider gross margins than its peer group. However, the firm has declining EPS growth. Finally, we note that Dollar Tree has weak revenue growth and a flat capital expenditure trend, irregular cash flows, and just enough current assets to cover current liabilities.