Phillips 66 meets some but not all of Benjamin Graham's requirements for a defensive stock. The Oil & Gas Integrated company does not offer a large enough margin of safety for cautious investors, but it does have many qualities that may interest more enterprising investors.
Phillips 66 Is Probably Overvalued
Graham devised the below equation to give investors a quick way of determining whether a stock is trading at a fair multiple of its earnings and its assets:
√(22.5 * 6 year average earnings per share (4.22) * 6 year average book value per share (67.143) = $57.32
After an impressive 44.0% performance over the 12 months, Phillips 66 is now trading well over its fair value because its Graham number is 108.4% above today's share price of $119.44. Even though the stock does not trade at an attractive multiple, it might still meet some of the other criteria for quality stocks that Graham listed in Chapter 14 of The Intelligent Investor.
Impressive Revenues, Consistent Profitability, and a Growing Dividend Imply Value
Phillips 66’s average sales revenue over the last 6 years has been $201.5 Billion, so by Graham’s standards the stock has sufficient revenues to make it worthy of investment. When published in 1972, Graham’s threshold was $100 million in average sales, which would be the equivalent of around a half million dollars today.
Ben Graham believed that a margin of safety could be obtained by investing only in companies with consistently positive retained earnings. Retained earnings represent the cumulative net earnings or (deficit) left to equity holders after dividends have been paid out. Phillips 66 had positive retained earnings from 2011 to 2022 with an average of $13.3 Billion over this period.
Ben Graham would also require a cumulative growth of Earnings Per Share of at least 30% over the last ten years.To determine Phillips 66's EPS growth over time, we will average out its EPS for 2010, 2011, and 2012, which were $1.16, $7.52, and $6.48 respectively. This gives us an average of $5.05 for the period of 2010 to 2012. Next, we compare this value with the average EPS reported in 2020, 2021, and 2022, which were $-1.23, $2.97, and $23.27, for an average of $8.34. Now we see that Phillips 66's EPS growth was 65.15% during this period, which satisfies Ben Graham's requirement.
Negative Current Asset to Liabilities Balance and an Average Current Ratio
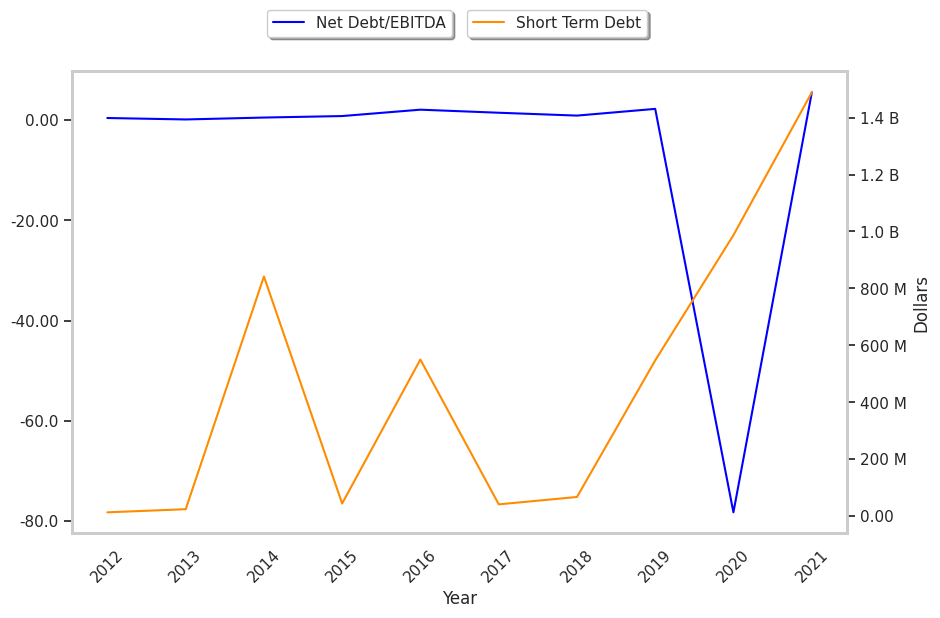
Graham sought companies with extremely low debt levels compared to their assets. For one, he expected their current ratio to be over 2 and their long term debt to net current asset ratio to be near, or ideally under, under 1. Phillips 66 fails on both counts with a current ratio of 1.2 and a debt to net current asset ratio of -0.7.
Conclusion
Phillips 66 offers a decent combination of value, growth, and profitability. These factors imply that the investment offers a decent margin of safety — especially if the shares are bought during a sell-off.
| 2017-02-17 | 2018-02-23 | 2019-02-22 | 2020-02-21 | 2021-02-24 | 2022-02-18 | |
|---|---|---|---|---|---|---|
| Revenue (MM) | $85,703 | $104,101 | $114,156 | $107,293 | $64,129 | $111,476 |
| Gross Margins | 27.0% | 24.0% | 14.0% | 11.0% | 10.0% | 8.0% |
| Operating Margins | 3% | 3% | 7% | 3% | -2% | 0% |
| Net Margins | 2.0% | 5.0% | 5.0% | 3.0% | -6.0% | 1.0% |
| Net Income (MM) | $1,555 | $5,106 | $5,595 | $3,076 | -$3,975 | $1,317 |
| Net Interest Expense (MM) | -$338 | -$438 | -$504 | -$458 | -$499 | -$581 |
| Depreciation & Amort. (MM) | -$1,168 | -$1,318 | -$1,356 | -$1,341 | -$1,395 | -$1,605 |
| Earnings Per Share | $2.93 | $9.85 | $11.8 | $6.78 | -$9.04 | $2.98 |
| EPS Growth | n/a | 236.18% | 19.8% | -42.54% | -233.33% | 132.96% |
| Diluted Shares (MM) | 530 | 519 | 474 | 454 | 440 | 442 |
| Free Cash Flow (MM) | $6,083 | $5,404 | $10,200 | $8,595 | $4,980 | $7,850 |
| Capital Expenditures (MM) | -$3,120 | -$1,756 | -$2,627 | -$3,787 | -$2,869 | -$1,833 |
| Net Current Assets (MM) | -$15,248 | -$12,553 | -$13,940 | -$17,156 | -$19,922 | -$19,260 |
| Long Term Debt (MM) | $9,588 | $10,069 | $11,093 | $11,216 | $14,906 | $12,959 |
| Net Debt / EBITDA | 2.06 | 1.45 | 0.88 | 2.22 | -78.24 | 5.52 |