Carnival was one of the market's biggest losers today, losing 5.3% of its value and underperforming both the S&P500 and Dow Industrial composite indices by 1.0%. The large-cap Consumer Discretionary company ended the day at $12.91, but is still well above its 52 week low of $6.11 and is 25.59% below its average target price of $17.35. Over the last 12 months, Carnival is up 66.0%, and has outperformed the S&P 500 by 53.0%. The stock has an average analyst rating of buy.
Carnival does not release its trailing 12 month price to earnings (P/E) ratio because its earnings per share of $-1.28 are negative over the last year. Since P/E ratios are the stock's price divided by its earnings per share, a negative EPS number will result in a negative P/E ratio. This doesn't tell us much besides the fact that the company is not currently profitable.
Based on Carnival's positive earnings guidance of $0.88, its stock has a forward P/E ratio of 14.7. Earnings refer to the net income of the company from its sales operations, and the P/E ratio tells us how much investors are willing to pay for each dollar of these earnings. In comparison, the Consumer Discretionary sector has historically had an average P/E ratio of 22.33.
Another metric for valuing a stock is its Price to Book (P/B) Ratio, which is its share price divided by its book value per share. The book value refers to the sum of all of the company's tangible assets and liabilities. Carnival's P/B ratio of 2.34 indicates that the company is fairly valued when compared to the Consumer Discretionary sector's average P/B ratio of 3.12.
To understand Carnival's business, and therefore its attractiveness as a potential investment, we must analyze its margins in two steps. First, we look at its gross margins, which take into account only the direct cost of providing the product or service to the customer. This enables us to determine whether the company benefits from an advantageous market position:
| Date Reported | Revenue ($ k) | Cost of Revenue ($ k) | Gross Margins (%) | YoY Growth (%) |
|---|---|---|---|---|
| 2023-01-27 | 12,169,000 | -11,317,000 | 7 | 106.25 |
| 2022-01-27 | 1,908,000 | -4,063,000 | -112 | -833.33 |
| 2021-01-26 | 5,594,000 | -6,278,000 | -12 | -122.64 |
| 2020-03-31 | 20,825,000 | -9,715,000 | 53 | -5.36 |
| 2019-01-28 | 18,880,000 | -8,103,000 | 56 | 40.0 |
| 2018-01-29 | 17,510,000 | -10,501,000 | 40 |
- Average gross margins: 5.3 %
- Average gross margins growth rate: 0.0 %
- Coefficient of variability (lower numbers indicate more stability): 1189.2 %
Next, we consider the Carnival's operating margins, which take into account overhead. This tells us whether the company's business model is fundamentally profitable or not:
| Date Reported | Total Revenue ($ k) | Operating Expenses ($ k) | Operating Margins (%) | YoY Growth (%) |
|---|---|---|---|---|
| 2023-01-27 | 12,169,000 | -4,790,000 | -32 | 90.27 |
| 2022-01-27 | 1,908,000 | -4,118,000 | -329 | -282.56 |
| 2021-01-26 | 5,594,000 | -4,119,000 | -86 | -637.5 |
| 2020-03-31 | 20,825,000 | -7,807,000 | 16 | -11.11 |
| 2019-01-28 | 18,880,000 | -7,438,000 | 18 | 5.88 |
| 2018-01-29 | 17,510,000 | -4,111,000 | 17 |
- Average operating margins: -66.0 %
- Average operating margins growth rate: -14.3 %
- Coefficient of variability (lower numbers indicate more stability): 204.8 %
From the above, we can see that Carnival is not a profitable business. While unprofitable businesses may provide shareholders with attractive short term returns, more conservative investors will prefer to wait until the business can reach a profit before committing.
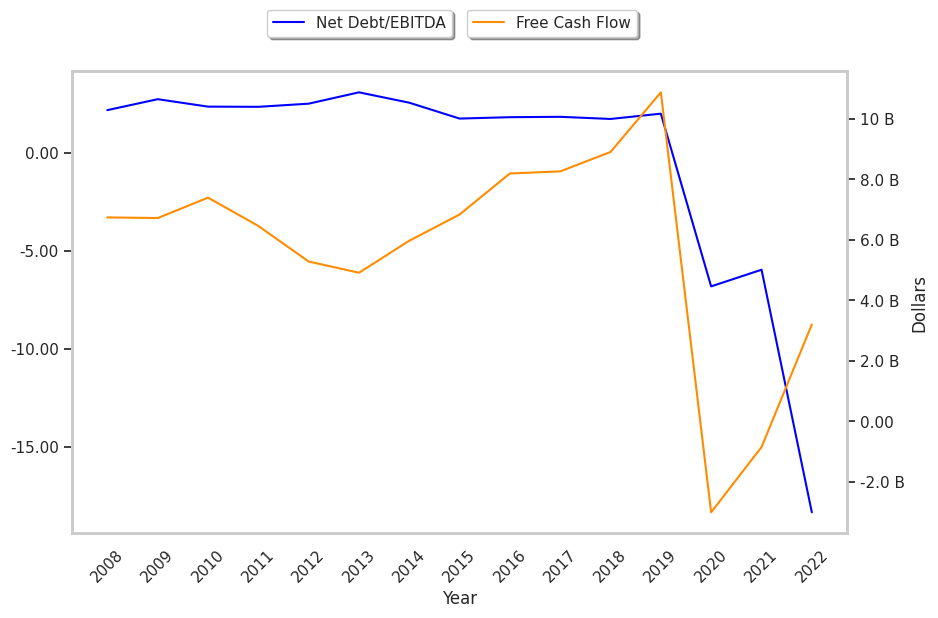
Our final point of analysis is Carnival's free cash flow. While earnings and margins are calculated on the basis of a company's delivered goods, they do not actually represent physical payments that flow into the coffers. The actually money that the company has -- minus its capital expenditures -- is reported as its free cash flow, which for Carnival is as follows:
| Date Reported | Cash Flow from Operations ($ k) | Capital expenditures ($ k) | Free Cash Flow ($ k) | YoY Growth (%) |
|---|---|---|---|---|
| 2023-01-27 | -1,669,000 | -4,870,000 | 3,201,000 | 475.26 |
| 2022-01-27 | -4,109,000 | -3,256,000 | -853,000 | 71.69 |
| 2021-01-26 | -6,299,000 | -3,286,000 | -3,013,000 | -127.69 |
| 2020-03-31 | 5,478,000 | -5,403,000 | 10,881,000 | 22.13 |
| 2019-01-28 | 5,549,000 | -3,360,000 | 8,909,000 | 7.78 |
| 2018-01-29 | 5,322,000 | -2,944,000 | 8,266,000 |
- Average free cash flow: $3.2 Billion
- Average free cash flow growth rate: 0.0 %
- Coefficient of variability (lower numbers indicating more stability): 7582361482.1%
Free cash flow represents the money that Carnival can use to either reinvest in the business or to reward its investors in the form of a dividend. Despite the company's recent cash flows being in the green, investors do not currently receive a dividend.
In conclusion, Carnival may be unattractive to investors with a low risk tolerance or a long term investment horizon. Stocks such as these may offer strong returns in the short term, but for now the long term potential of the company is not substantiated -- by the numbers, at least.