Data Processing Services company Cloudflare stunned Wall Street today as it plummeted to $59.57, marking a -4.7% change compared to the S&P 500 and the Nasdaq indices, which logged -1.0% and -1.0% respectively. NET is -15.06% below its average analyst target price of $70.13, which implies there is more upside for the stock. However, the average analayst rating for the stock is hold -- a more pessimistic outlook than you might expect. Over the last year, Cloudflare has lagged behind the S&P 500 by -15.0%, moving -2.0%.
Cloudflare does not release its trailing 12 month P/E ratio since its earnings per share of $-0.69 are negative over the last year. But we can calculate it ourselves, which gives us a trailing P/E ratio for NET of -86.3. Based on the company's positive earnings guidance of $0.45, the stock has a forward P/E ratio of 132.4. The average trailing Price to Earnings (P/E) ratio of US-based technology companies is 27.16 as of first quarter of 2023. In contrast, the S&P 500 average is 15.97. The P/E ratio is the company's share price divided by its earnings per share. In other words, it represents how much investors are willing to spend for each dollar of the company's earnings (revenues minus the cost of goods sold, taxes, and overhead).
NET’s price to earnings ratio can be divided by its projected five-year growth rate, to give us the price to earnings, or PEG ratio. This allows us to put its earnings valuation in the context of its growth expectations which is useful because companies with low P/E ratios often have low growth, which means they actually do not present an attractive value.
When we perform the calculation for Cloudflare, we obtain a PEG ratio of 2.72, which indicates that the company is overvalued compared to its growth prospects. The weakness with PEG ratios is that they rely on expected growth estimates, which of course may not turn out as expected.
To better understand the strength of Cloudflare's business, we can analyse its operating margins, which are its revenues minues its operating costs. Consistently strong margins backed by a positive trend can signal that a company is on track to deliver returns for its shareholders. Here's the operating margin statistics for the last four years:
| Date Reported | Total Revenue ($ k) | Operating Expenses ($ k) | Operating Margins (%) | YoY Growth (%) |
|---|---|---|---|---|
| 2023-02-24 | 975,241 | -943,834 | -21 | -10.53 |
| 2022-03-01 | 656,426 | -636,976 | -19 | 24.0 |
| 2021-02-25 | 431,059 | -436,772 | -25 | 34.21 |
| 2020-02-10 | 287,022 | -331,545 | -38 |
- Average operating margins: -25.8%
- Average operating margins growth rate: 14.2%
- Coefficient of variability (lower numbers indicate less volatility): 33.2%
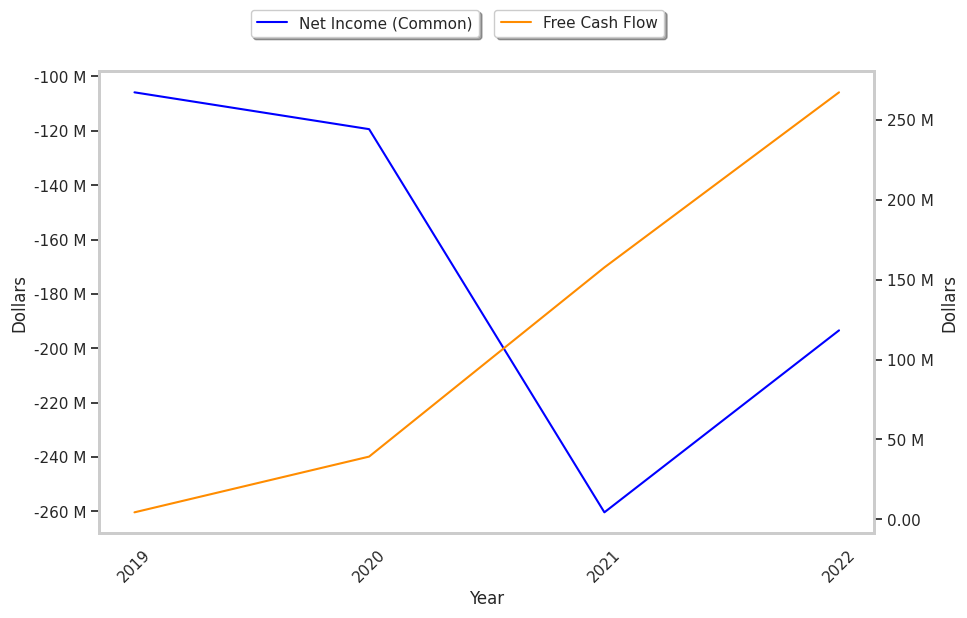
Cloudflare's financial viability can also be assessed through a review of its free cash flow trends. Free cash flow refers to its operating cash flows minues its capital expenditures, which are expenses related to the maintenance of fixed assets such as land, infrastructure, and equipment. Over the last four years, the trends have been as follows:
| Date Reported | Cash Flow from Operations ($ k) | Capital expenditures ($ k) | Free Cash Flow ($ k) | YoY Growth (%) |
|---|---|---|---|---|
| 2023-02-24 | 123,595 | -143,606 | 267,201 | 69.51 |
| 2022-03-01 | 64,648 | -92,986 | 157,634 | 301.66 |
| 2021-02-25 | -17,129 | -56,375 | 39,246 | 797.67 |
| 2020-02-10 | -38,917 | -43,289 | 4,372 |
- Average free cash flow: $117.11 Million
- Average free cash flow growth rate: 0.0%
- Coefficient of variability (lower numbers indicating more stability): 40943621.3%
Free cash flows represents the amount of money that is available for reinvesting in the business, or paying out to investors in the form of a dividend. With a positive cash flow as of the last fiscal year, NET is in a position to do either -- which can encourage more investors to place their capital in the company.
Another valuation metric for analyzing a stock is its Price to Book (P/B) Ratio, which consists in its share price divided by its book value per share. The book value refers to the present liquidation value of the company, as if it sold all of its assets and paid off all debts. As of the first quarter of 2023, the average P/B ratio for technology companies is 6.23. In contrast, the average P/B ratio of the S&P 500 is 2.95. Cloudflare's P/B ratio indicates that the market value of the company exceeds its book value by a factor of 30, so it's likely that equity investors are over-valuing the company's assets.
Since it has a negative P/E ratio, an elevated P/B ratio, a pattern of improving cash flows with a flat trend, Cloudflare is likely overvalued at today's prices. The company has mixed growth prospects because of a negative PEG ratio and consistently negative margins with a positive growth rate. We hope you enjoyed this basic overview of NET's fundamentals. Make sure to check the numbers for yourself, especially focusing on their trends over the last few years.