We've been asking ourselves recently if the market has placed a fair valuation on T-Mobile US. Let's dive into some of the fundamental values of this large-cap Telecommunications company to determine if there might be an opportunity here for value-minded investors.
A Lower P/B Ratio Than Its Sector Average but Trades Above Its Graham Number:
T-Mobile US, Inc., together with its subsidiaries, provides mobile communications services in the United States, Puerto Rico, and the United States Virgin Islands. The company belongs to the Telecommunications sector, which has an average price to earnings (P/E) ratio of 18.85 and an average price to book (P/B) ratio of 3.12. In contrast, T-Mobile US has a trailing 12 month P/E ratio of 27.5 and a P/B ratio of 2.48.
When we divideT-Mobile US's P/E ratio by its expected five-year EPS growth rate, we obtain a PEG ratio of 0.29, which indicates that the market is undervaluing the company's projected growth (a PEG ratio of 1 indicates a fairly valued company). Your analysis of the stock shouldn't end here. Rather, a good PEG ratio should alert you that it may be worthwhile to take a closer look at the stock.
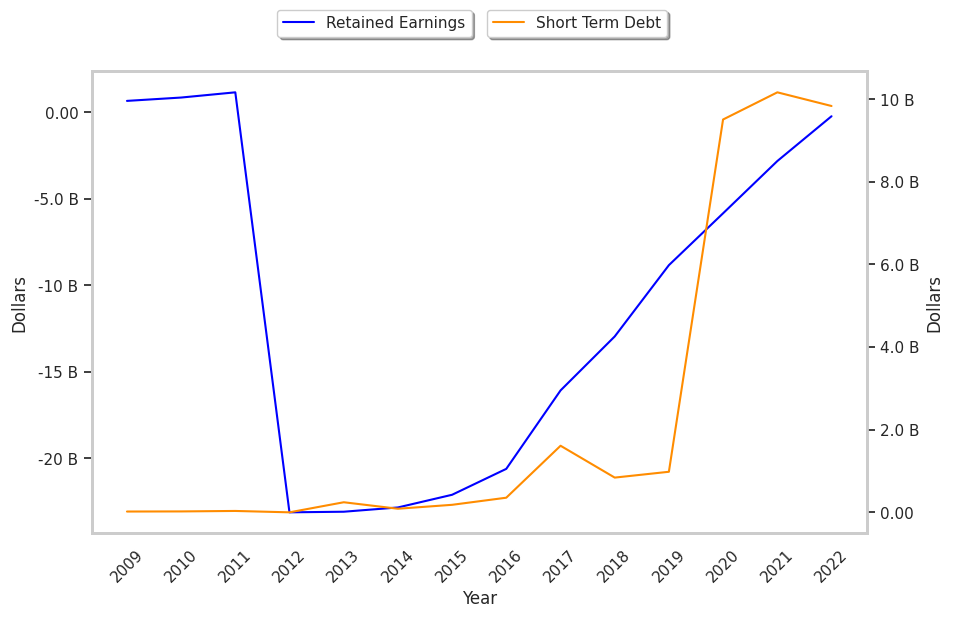
The Company Has a Highly Leveraged Balance Sheet:
| 2018-02-08 | 2019-02-07 | 2020-02-06 | 2021-02-23 | 2022-02-11 | 2023-02-14 | |
|---|---|---|---|---|---|---|
| Revenue (MM) | $40,604 | $43,310 | $44,998 | $68,397 | $80,118 | $79,571 |
| Gross Margins | 56.0% | 57.0% | 59.0% | 59.0% | 54.0% | 54.0% |
| Operating Margins | 11% | 12% | 13% | 10% | 9% | 10% |
| Net Margins | 11.0% | 7.0% | 8.0% | 4.0% | 4.0% | 3.0% |
| Net Income (MM) | $4,536 | $2,888 | $3,468 | $3,064 | $3,024 | $2,590 |
| Net Interest Expense (MM) | -$1,654 | -$1,338 | -$1,111 | -$2,701 | -$3,342 | -$3,364 |
| Depreciation & Amort. (MM) | -$5,984 | -$6,486 | -$6,616 | -$14,151 | -$16,383 | -$13,651 |
| Earnings Per Share | $5.14 | $3.36 | $4.02 | $2.65 | $2.41 | $2.06 |
| EPS Growth | n/a | -34.63% | 19.64% | -34.08% | -9.06% | -14.52% |
| Diluted Shares (MM) | 872 | 858 | 863 | 1,155 | 1,254 | 1,255 |
| Free Cash Flow (MM) | $14,896 | $9,567 | $14,182 | $21,007 | $35,609 | $34,082 |
| Capital Expenditures (MM) | -$11,065 | -$5,668 | -$7,358 | -$12,367 | -$21,692 | -$17,301 |
| Net Current Assets (MM) | -$39,089 | -$39,469 | -$48,827 | -$110,933 | -$116,570 | -$122,615 |
| Long Term Debt (MM) | $26,707 | $26,706 | $24,944 | $66,546 | $68,570 | $66,796 |
| Net Debt / EBITDA | 2.55 | 2.23 | 1.98 | 3.1 | 3.1 | 3.31 |
T-Mobile US has weak revenue growth and a flat capital expenditure trend, weak operating margings with a stable trend, and flat EPS growth. In addition, we note irregular cash flows. Furthermore, the firm suffers from slimmer gross margins than its peers and a highly leveraged balance sheet.