Citigroup shares fell by -1.3% during the day's morning session, and are now trading at a price of $39.34. Is it time to buy the dip? To better answer that question, it's essential to check if the market is valuing the company's shares fairly in terms of its earnings and equity levels.
Citigroup Has Attractive Multiples and Trades Below Its Graham Number:
Citigroup Inc., a diversified financial services holding company, provides various financial products and services to consumers, corporations, governments, and institutions in North America, Latin America, Asia, Europe, the Middle East, and Africa. The company belongs to the Finance sector, which has an average price to earnings (P/E) ratio of 14.34 and an average price to book (P/B) ratio of 1.57. In contrast, Citigroup has a trailing 12 month P/E ratio of 6.2 and a P/B ratio of 0.4.
Citigroup's PEG ratio is 1.76, which shows that the stock is probably overvalued in terms of its estimated growth. For reference, a PEG ratio near or below 1 is a potential signal that a company is undervalued.
EPS Trend Sustained Primarily by Reducing the Number of Shares Outstanding:
| 2017-02-24 | 2018-02-23 | 2019-02-22 | 2020-02-21 | 2021-02-26 | 2022-02-28 | |
|---|---|---|---|---|---|---|
| Revenue (MM) | $69,875 | $72,444 | $72,854 | $75,067 | $75,501 | $71,884 |
| Operating Margins | 31% | 31% | 32% | 32% | 18% | 38% |
| Net Margins | 21% | -9% | 25% | 26% | 15% | 31% |
| Net Income (MM) | $14,912 | -$6,798 | $18,045 | $19,401 | $11,047 | $21,952 |
| Earnings Per Share | $5.16 | -$2.52 | $7.23 | $8.56 | $5.26 | $10.97 |
| EPS Growth | n/a | -148.84% | 386.9% | 18.4% | -38.55% | 108.56% |
| Diluted Shares (MM) | 2,888 | 2,698 | 2,495 | 2,265 | 2,099 | 2,002 |
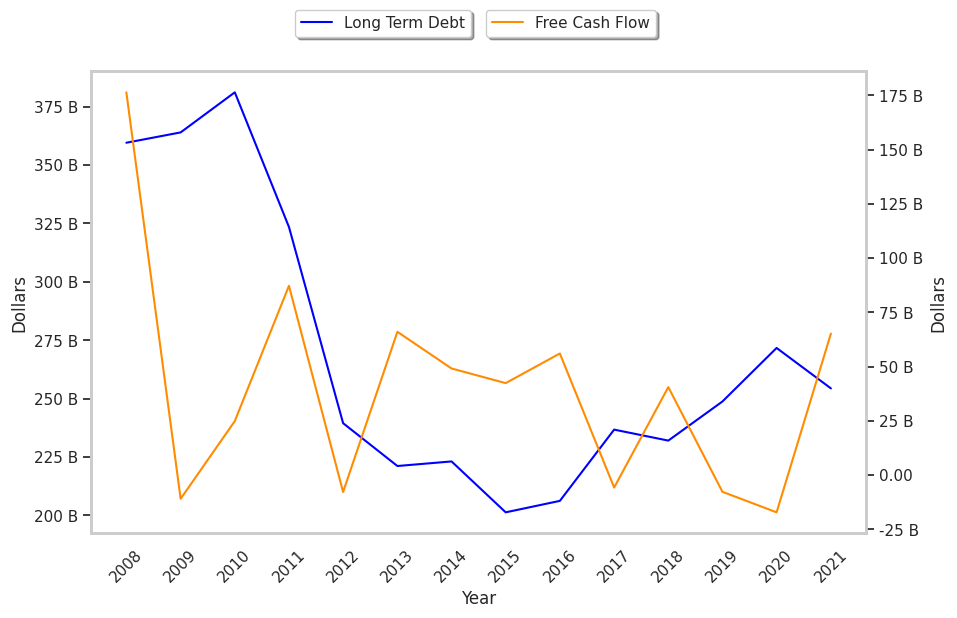
| Free Cash Flow (MM) | $56,021 | -$5,790 | $40,514 | -$7,760 | -$17,225 | $65,178 |
| Capital Expenditures (MM) | -$2,089 | -$2,984 | -$3,562 | -$5,077 | -$3,396 | -$3,929 |
| Long Term Debt (MM) | $206,178 | $236,709 | $231,999 | $248,760 | $271,686 | $254,374 |
Citigroup has weak revenue growth and a flat capital expenditure trend, decent net margins with a stable trend, and irregular cash flows. We also note that the company has low debt levels working in its favor. However, the firm has EPS growth achieved by reducing the number of outstanding shares.