Now trading at a price of $31.66, Honda Motor Company has moved -3.1% so far today.
Honda Motor Company returned gains of 40.0% last year, with its stock price reaching a high of $36.82 and a low of $21.44. Over the same period, the stock outperformed the S&P 500 index by 27.0%. More recently, the company's 50-day average price was $32.69. Honda Motor Co., Ltd. develops, manufactures, and distributes motorcycles, automobiles, power, and other products in Japan, North America, Europe, Asia, and internationally. Based in Tokyo, Japan, the large-cap Consumer Discretionary company has 197,039 full time employees. Honda Motor Company has offered a 122.4% dividend yield over the last 12 months.
Shareholders Are Confronted With a Declining EPS Growth Trend:
| 2017-03-31 | 2018-03-31 | 2019-03-31 | 2020-03-31 | 2021-03-31 | 2022-03-31 | |
|---|---|---|---|---|---|---|
| Revenue (MM) | $13,999,200 | $15,361,146 | $15,888,617 | $14,931,009 | $13,170,519 | $13,170,519 |
| Gross Margins | 22.0% | 22.0% | 21.0% | 21.0% | 21.0% | 21.0% |
| Operating Margins | 6% | 5% | 5% | 4% | 5% | 5% |
| Net Margins | 4.0% | 7.0% | 4.0% | 7.0% | 5.0% | 11.0% |
| Net Income (MM) | $616,569 | $1,059,337 | $610,316 | $1,019,864 | $657,425 | $1,390,888 |
| Net Interest Expense (MM) | $19,918 | $28,221 | $35,401 | $24,723 | $5,928 | $5,928 |
| Depreciation & Amort. (MM) | -$674,329 | -$713,093 | -$721,695 | -$699,877 | -$624,239 | -$611,063 |
| Earnings Per Share | $342.1 | $615.91 | $354.84 | $592.96 | $382.23 | $808.67 |
| EPS Growth | n/a | 80.04% | -42.39% | 67.11% | -35.54% | 111.57% |
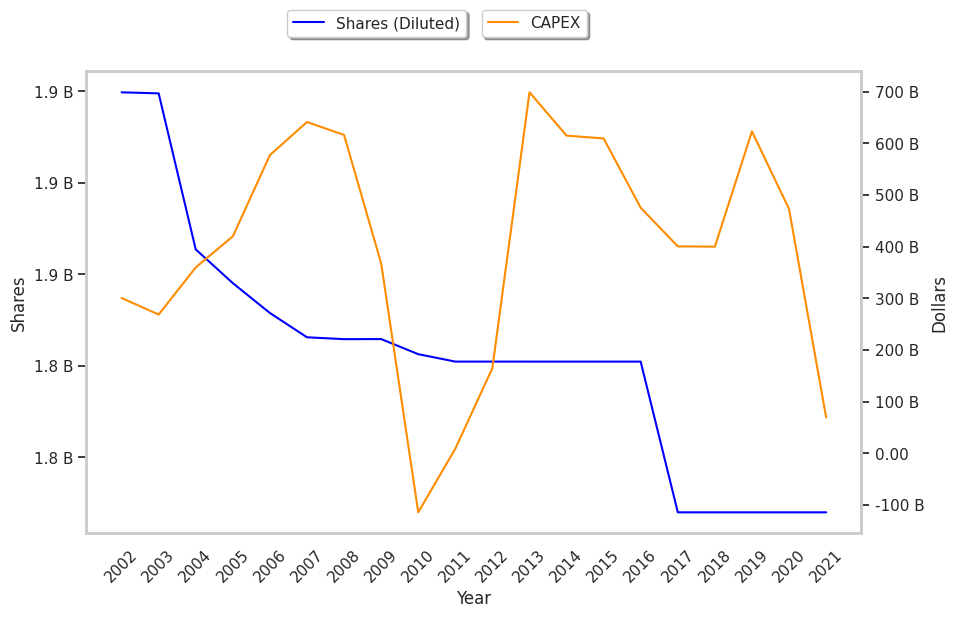
| Diluted Shares (MM) | 1,802 | 1,720 | 1,720 | 1,720 | 1,720 | 1,720 |
| Free Cash Flow (MM) | $1,360,495 | $1,388,192 | $1,175,991 | $1,873,326 | $1,707,177 | $1,577,457 |
| Capital Expenditures (MM) | -$475,422 | -$400,521 | -$400,003 | -$623,234 | -$473,219 | -$69,435 |
| Net Current Assets (MM) | -$4,833,030 | -$4,189,781 | -$4,506,038 | -$4,874,432 | -$4,969,100 | -$4,359,182 |
| Long Term Debt (MM) | $4,069,431 | $3,941,754 | $4,206,027 | $4,524,799 | $4,996,170 | $5,266,335 |
| Net Debt / EBITDA | 3.12 | 2.91 | 3.36 | 3.84 | 1.65 | 1.27 |
Honda Motor Company has weak revenue growth and a flat capital expenditure trend, weak operating margings with a stable trend, and irregular cash flows. In addition, we note just enough current assets to cover current liabilities. We also note that the company benefits from wider gross margins than its peer group and healthy leverage. However, the firm has declining EPS growth.
Honda Motor Company's Earnings and Assets May Be Undervalued:
Honda Motor Company has a trailing twelve month P/E ratio of 9.5, compared to an average of 22.33 for the Consumer Discretionary sector. Based on its EPS guidance of $3.07, the company has a forward P/E ratio of 10.6. The company doesn't issue forward earnings guidance, and the compound average growth rate of its last 6 years of reported EPS is -53.5%. On this basis, the company's PEG ratio is -0.18, which indicates that its shares are overpriced. In contrast, the market is likely undervaluing Honda Motor Company in terms of its equity because its P/B ratio is 0.01 while the sector average is 3.12. The company's shares are currently trading -99.7% below their Graham number.
Most of the Market Indicators on Honda Motor Company Are Negative:
The 2 analysts following Honda Motor Company have set target prices ranging from $35.63 to $36.93 per share, for an average of $36.28 with a buy rating. As of April 2023, the company is trading -9.9% away from its average target price, indicating that there is an analyst consensus of some upside potential.
The largest shareholder is Dodge & Cox Inc, whose 2% stake in the company is worth $1,400,283,009.