It hasn't been a great afternoon session for L3Harris Technologies investors, who have watched their shares sink by -1.9% to a price of $166.14. Some of you might be wondering if it's time to buy the dip. If you are considering this, make sure to check the company's fundamentals first to determine if the shares are fairly valued at today's prices.
A Lower P/B Ratio Than Its Sector Average but Trades Above Its Graham Number:
L3Harris Technologies, Inc., an aerospace and defense technology company, provides mission-critical solutions for government and commercial customers worldwide. The company belongs to the Industrials sector, which has an average price to earnings (P/E) ratio of 20.49 and an average price to book (P/B) ratio of 3.78. In contrast, L3Harris Technologies has a trailing 12 month P/E ratio of 39.3 and a P/B ratio of 1.7.
L3Harris Technologies's PEG ratio is 12.11, which shows that the stock is probably overvalued in terms of its estimated growth. For reference, a PEG ratio near or below 1 is a potential signal that a company is undervalued.
The Company Has a Highly Leveraged Balance Sheet:
| 2017-12-31 | 2018-12-31 | 2020-02-25 | 2021-03-01 | 2022-02-25 | 2023-02-24 | |
|---|---|---|---|---|---|---|
| Revenue (MM) | $5,900 | $6,182 | $9,263 | $18,194 | $17,814 | $17,062 |
| Gross Margins | 37.0% | 36.0% | 27.0% | 28.0% | 30.0% | 28.0% |
| Operating Margins | 18% | 18% | 7% | 11% | 12% | 11% |
| Net Margins | 9.0% | 12.0% | 9.0% | 6.0% | 10.0% | 6.0% |
| Net Income (MM) | $553 | $718 | $822 | $1,119 | $1,846 | $1,062 |
| Net Interest Expense (MM) | -$170 | -$168 | -$123 | -$254 | -$265 | -$279 |
| Depreciation & Amort. (MM) | -$311 | -$259 | -$153 | -$323 | -$340 | -$333 |
| Earnings Per Share | $4.45 | $5.93 | $6.82 | $5.18 | $9.38 | $5.23 |
| EPS Growth | n/a | 33.26% | 15.01% | -24.05% | 81.08% | -44.24% |
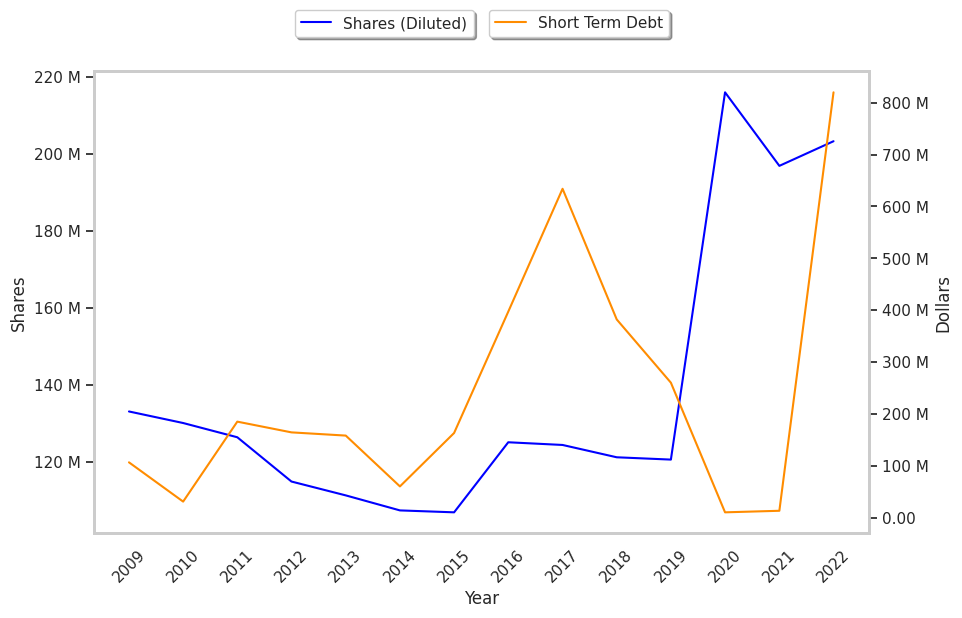
| Diluted Shares (MM) | 124 | 121 | 120 | 216 | 197 | 203 |
| Free Cash Flow (MM) | $688 | $887 | $1,092 | $3,067 | $3,012 | $2,378 |
| Capital Expenditures (MM) | -$119 | -$136 | -$153 | -$277 | -$325 | -$220 |
| Net Current Assets (MM) | -$5,089 | -$4,349 | -$9,280 | -$9,452 | -$9,031 | -$8,146 |
| Long Term Debt (MM) | $3,396 | $3,408 | $6,694 | $6,943 | $7,048 | $6,225 |
| Net Debt / EBITDA | 2.56 | 2.54 | 7.58 | 2.45 | 2.51 | 2.73 |
L3Harris Technologies has weak revenue growth and a flat capital expenditure trend, average net margins with a negative growth trend, and flat EPS growth. The company's financial statements also display irregular cash flows and just enough current assets to cover current liabilities. Furthermore, the firm suffers from slimmer gross margins than its peers and a highly leveraged balance sheet.