Standing out among the Street's worst performers today is Schlumberger, a oil & gas equipment & services company whose shares slumped -5.2% to a price of $55.56, 17.21% below its average analyst target price of $67.11.
The average analyst rating for the stock is buy. SLB underperformed the S&P 500 index by -5.0% during today's afternoon session, but outpaced it by 22.0% over the last year with a return of 35.0%.
Schlumberger Limited engages in the provision of technology for the energy industry worldwide. The company operates through four divisions: Digital & Integration, Reservoir Performance, Well Construction, and Production Systems. The company provides field development and hydrocarbon production, carbon management, integration of adjacent energy systems; reservoir interpretation and data processing services for exploration data; and well construction and production improvement services and products. The company is an energy company. As investments, energy companies may display higher than average volatility because the price and availability of basic materials needed for production is dependent on geopolitical events. The shift towards renewable forms of energy may lessen this dependency, but is far from complete and may involve new risks of its own.
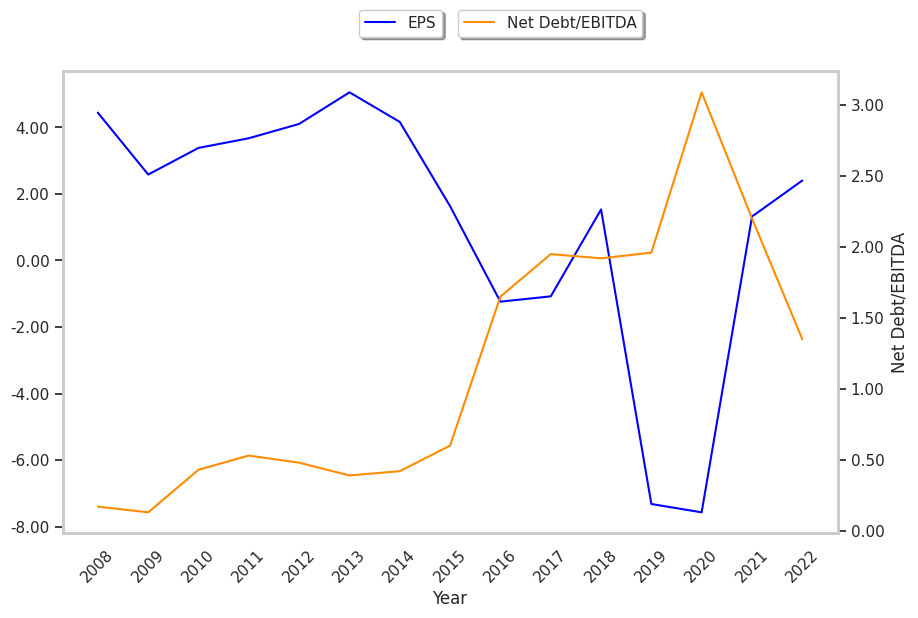
Schlumberger's trailing 12 month P/E ratio is 20.4, based on its trailing EPS of $2.73. The company has a forward P/E ratio of 15.1 according to its forward EPS of $3.67 -- which is an estimate of what its earnings will look like in the next quarter. As of the first quarter of 2023, the average Price to Earnings (P/E) ratio for US energy companies is 7.54, and the S&P 500 has an average of 15.97. The P/E ratio consists in the stock's share price divided by its earnings per share (EPS), representing how much investors are willing to spend for each dollar of the company's earnings. Earnings are the company's revenues minus the cost of goods sold, overhead, and taxes.
A significant limitation with the price to earnings analysis is that it doesn’t account for investors’ growth expectations in the company. For example, a company with a low P/E ratio may not actually be a good value if it has little growth potential. Conversely, companies with high P/E ratios may be fairly valued in terms of growth expectations.
When we divide Schlumberger's P/E ratio by its projected 5 year earnings growth rate, we see that it has a Price to Earnings Growth (PEG) ratio of 0.6. This tells us that the company is largely undervalued in terms of growth expectations -- but remember, these growth expectations could turn out to be wrong!
To understand a company's long term business prospects, we must consider its gross profit margins, which is the ratio of its gross profits to its revenues. A wider gross profit margin indicates that a company may have a competitive advantage, as it is free to keep its product prices high relative to their cost. After looking at its annual reports, we obtained the following information on SLB's margins:
| Date Reported | Revenue ($ k) | Cost of Revenue ($ k) | Gross Margins (%) | YoY Growth (%) |
|---|---|---|---|---|
| 2023-01-25 | 28,091,000 | -22,930,000 | 18 | 12.5 |
| 2022-01-26 | 22,929,000 | -19,271,000 | 16 | 45.45 |
| 2021-01-27 | 23,601,000 | -21,000,000 | 11 | -15.38 |
| 2020-01-22 | 32,917,000 | -28,720,000 | 13 | 0.0 |
| 2019-01-23 | 32,815,000 | -28,478,000 | 13 | 0.0 |
| 2018-01-24 | 30,440,000 | -26,543,000 | 13 |
- Average gross margin: 14.0 %
- Average gross margin growth rate: 0.3 %
- Coefficient of variability (higher numbers indicating more instability): 18.1 %
We can see from the above that Schlumberger's gross margins are very strong. Potential investors in the stock will want to determine what factors, if any, could derail this attractive growth story.
To deepen our understanding of the company's finances, we should study the effect of its depreciation and capital expenditures on the company's bottom line. We can see the effect of these additional factors in Schlumberger's free cash flow, which was $5.0 Billion as of its most recent annual report. The balance of cash flows represents the capital that is available for re-investment in the business, or for payouts to equity investors as dividends. The company's average cash flow over the last 4 years has been $6.27 Billion and they've been growing at an average rate of 0.0%. SLB's weak free cash flow trend shows that it might not be able to sustain its dividend payments, which over the last 12 months has yielded 1.5% to investors. Cutting the dividend can compound a company's problems by causing investors to sell their shares, which further pushes down its stock price.
Another valuation metric for analyzing a stock is its Price to Book (P/B) Ratio, which consists in its share price divided by its book value per share. The book value refers to the present liquidation value of the company, as if it sold all of its assets and paid off all debts). Schlumberger's P/B ratio is 4.24 -- in other words, the market value of the company exceeds its book value by a factor of more than 4, so the company's assets may be overvalued compared to the average P/B ratio of the Energy sector, which stands at 1.68 as of the first quarter of 2023.
Schlumberger is likely overvalued at today's prices because it has an inflated P/E ratio, an elevated P/B ratio, and irregular cash flows with a flat trend. The stock has strong growth indicators because of its strong margins with a positive growth rate, and an inflated PEG ratio. We hope this preliminary analysis will encourage you to do your own research into SLB's fundamental values -- especially their trends over the last few years, which provide the clearest picture of the company's valuation.