Acuity Brands logged a -0.0% change during today's morning session, and is now trading at a price of $178.94 per share.
Acuity Brands returned gains of 9.0% last year, with its stock price reaching a high of $202.9 and a low of $149.3. Over the same period, the stock underperformed the S&P 500 index by -5.0%. As of April 2023, the company's 50-day average price was $163.37. Acuity Brands, Inc. provides lighting and building management solutions in North America and internationally. The mid-cap Consumer Discretionary company is based in Atlanta, GA. Acuity Brands has not offered a dividend during the last year.
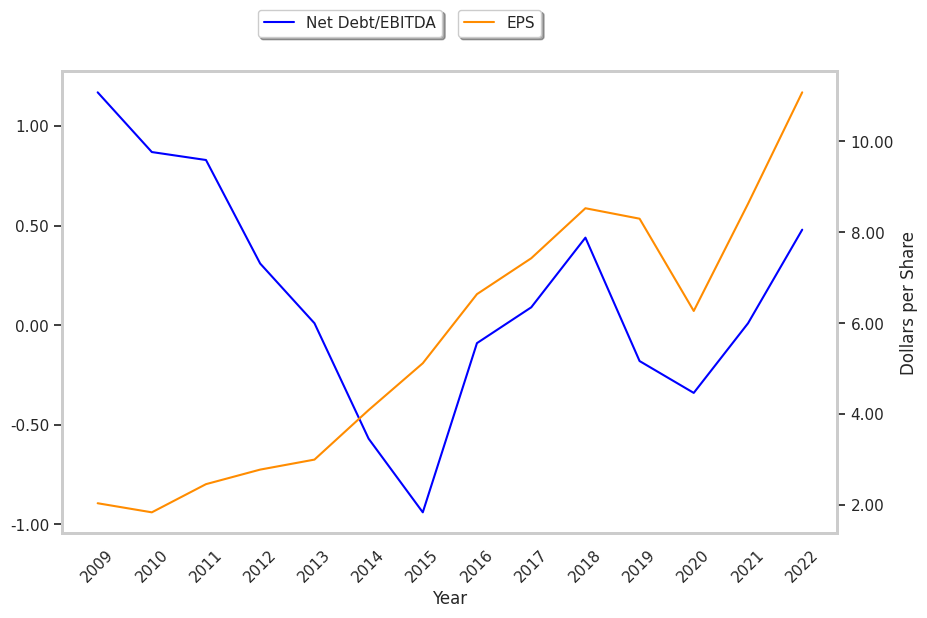
EPS Trend Sustained Primarily by Reducing the Number of Shares Outstanding:
| 2017-10-26 | 2018-10-25 | 2019-10-29 | 2020-10-23 | 2021-10-27 | 2022-10-26 | |
|---|---|---|---|---|---|---|
| Revenue (MM) | $3,505 | $3,680 | $3,673 | $3,326 | $3,461 | $4,006 |
| Gross Margins | 42.0% | 40.0% | 40.0% | 42.0% | 43.0% | 42.0% |
| Operating Margins | 15% | 13% | 13% | 11% | 12% | 13% |
| Net Margins | 9.0% | 9.0% | 9.0% | 7.0% | 9.0% | 10.0% |
| Net Income (MM) | $322 | $350 | $330 | $248 | $306 | $384 |
| Net Interest Expense (MM) | -$32 | -$34 | -$33 | -$23 | -$23 | -$25 |
| Depreciation & Amort. (MM) | -$75 | -$80 | -$88 | -$101 | -$100 | -$95 |
| Earnings Per Share | $7.43 | $8.53 | $8.3 | $6.27 | $8.63 | $11.08 |
| EPS Growth | n/a | 14.8% | -2.7% | -24.46% | 37.64% | 28.39% |
| Diluted Shares (MM) | 43 | 41 | 40 | 40 | 36 | 35 |
| Free Cash Flow (MM) | $398 | $395 | $548 | $560 | $448 | $364 |
| Capital Expenditures (MM) | -$62 | -$44 | -$53 | -$55 | -$39 | -$48 |
| Net Current Assets (MM) | $12 | -$61 | $188 | $76 | $14 | -$102 |
| Long Term Debt (MM) | $364 | $364 | $354 | $377 | $494 | $495 |
| Net Debt / EBITDA | 0.09 | 0.44 | -0.18 | -0.34 | 0.01 | 0.48 |
Acuity Brands has low leverage, wider gross margins than its peer group, and average operating margins with a stable trend. However, the firm has EPS growth achieved by reducing the number of outstanding shares. Finally, we note that Acuity Brands has weak revenue growth and a flat capital expenditure trend, irregular cash flows, and a decent current ratio.
A Very Low P/E Ratio but Trades Above Its Graham Number:
Acuity Brands has a trailing twelve month P/E ratio of 13.2, compared to an average of 22.33 for the Consumer Discretionary sector. Based on its EPS guidance of $14.06, the company has a forward P/E ratio of 11.6. The company doesn't issue forward earnings guidance, and the compound average growth rate of its last 6 years of reported EPS is 8.8%. On this basis, the company's PEG ratio is 1.5, which shows that it is fairly priced. In contrast, the market is likely undervaluing Acuity Brands in terms of its equity because its P/B ratio is 2.82 while the sector average is 3.12. The company's shares are currently trading 52.6% above their Graham number.
Acuity Brands Has an Average Rating of Hold:
The 7 analysts following Acuity Brands have set target prices ranging from $170.0 to $210.0 per share, for an average of $186.43 with a hold rating. As of April 2023, the company is trading -12.4% away from its average target price, indicating that there is an analyst consensus of some upside potential.
Acuity Brands has an above average percentage of its shares sold short because 10.8% of the company's shares are sold short. Institutions own 102.2% of the company's shares, and the insider ownership rate stands at 0.18%, suggesting a small amount of insider investors. The largest shareholder is Vanguard Group Inc, whose 11% stake in the company is worth $604,768,799.