D/B/A Compass Diversified does not have the profile of a defensive investment based on the requirements of Ben Graham. The Furnishings, Fixtures & Appliances firm may nonetheless be of interest to more risk-oriented investors who have a solid thesis on the company's future growth. At Market Inference, we remain agnostic as to such further developments, and prefer to use a company's past track record as the bellwether for future potential gains.
D/B/A Compass Diversified Is Probably Overvalued
Graham devised the below equation to give investors a quick way of determining whether a stock is trading at a fair multiple of its earnings and its assets:
√(22.5 * 6 year average earnings per share (1.34) * 6 year average book value per share (12.141) = $14.87
At today's price of $18.23 per share, D/B/A Compass Diversified is now trading 22.6% above the maximum price that Graham would have wanted to pay for the stock.
Even though the stock does not trade at an attractive multiple, it might still meet some of the other criteria for quality stocks that Graham listed in Chapter 14 of The Intelligent Investor.
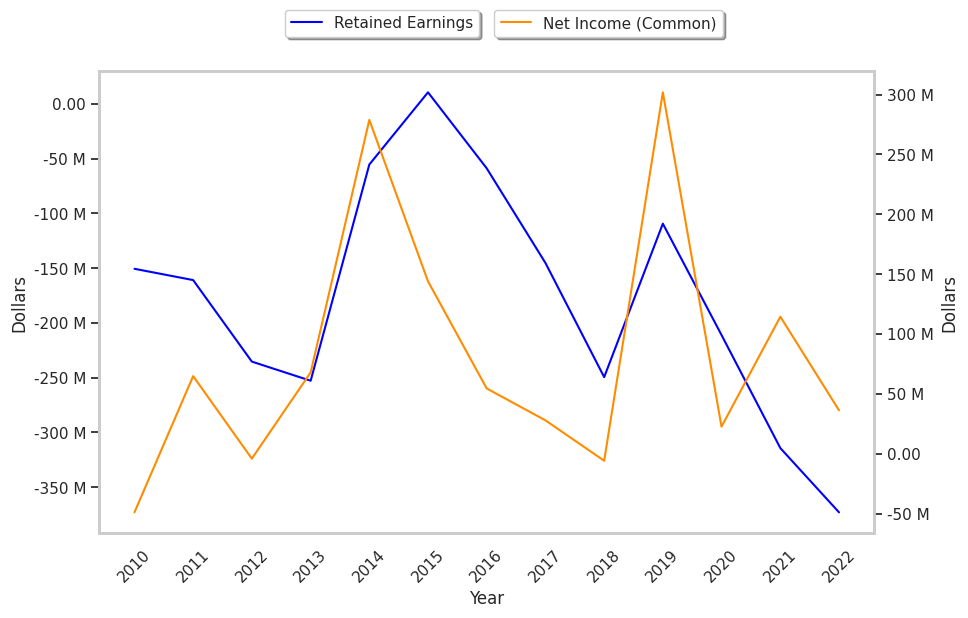
Negative Retained Earnings In 2019, 2020, And 2021, A Solid Record Of Dividends, and Decreasing Earnings Per Share
Ben Graham wrote that an investment in a company with a record of positive retained earnings could contribute significantly to the margin of safety. However, D/B/A Compass Diversified had negative retained earnings in 2019, 2020, and 2021 with an average of $-177328384.6153846 over this period.
Another one of Graham's requirements is for a 30% or more cumulative growth rate of the company's earnings per share over the last ten years.We are going to compare D/B/A Compass Diversified's earnings per share averages from the two 'bookends' of the 12 year period for which we have data. The first bookend comprises the years 2011, 2012, and 2013, whose EPS values of $1.37, $-0.08, and $1.05 average out to $0.78. Next we look at the years 2020, 2021, and 2022, whose values of $-0.34, $0.73, and $-0.10 average out to $0.10. The growth rate between the two averages does not meet Graham's standard since it is -87.18%.
D/B/A Compass Diversified has offered a regular dividend since at least 2009. The company has returned an average dividend yield of 6.6% over the last five years.
D/B/A Compass Diversified’s Balance Sheet Meets Graham’s Criteria
It was also essential to Graham that the company’s current assets outweigh its current liabilities, and that its long term debt be inferior to the sum of its net current assets (current assets minus total liabilities). This is the aspect of the analysis that most companies fail, yet D/B/A Compass Diversified passes comfortably, with an average current ratio of 3.4, and average debt to net current asset ratio of -1.4.
Conclusion
According to Graham's analysis, D/B/A Compass Diversified is likely a company of average quality, which does not offer a significant enough margin of safety for a risk averse investor.
| 2018-02-28 | 2019-02-27 | 2020-02-26 | 2021-02-24 | 2022-02-24 | 2023-03-01 | |
|---|---|---|---|---|---|---|
| Revenue (MM) | $1,270 | $1,357 | $1,263 | $1,448 | $1,932 | $2,264 |
| Gross Margins | 35.0% | 35.0% | 36.0% | 37.0% | 40.0% | 40.0% |
| Operating Margins | 4% | 4% | 5% | 5% | 9% | 9% |
| Net Margins | 2.0% | 0.0% | 24.0% | 2.0% | 6.0% | 2.0% |
| Net Income (MM) | $28 | -$6 | $302 | $23 | $115 | $36 |
| Net Interest Expense (MM) | -$28 | -$55 | -$58 | -$46 | -$59 | -$84 |
| Depreciation & Amort. (MM) | -$82 | -$91 | -$83 | -$95 | -$120 | -$139 |
| Earnings Per Share | $0.47 | -$0.1 | $5.04 | $0.36 | $1.76 | $0.51 |
| EPS Growth | n/a | -121.28% | 5140.0% | -92.86% | 388.89% | -71.02% |
| Diluted Shares (MM) | 60 | 60 | 60 | 63 | 65 | 71 |
| Free Cash Flow (MM) | $120 | $155 | $111 | $178 | $175 | $36 |
| Capital Expenditures (MM) | -$38 | -$41 | -$27 | -$29 | -$41 | -$64 |
| Net Current Assets (MM) | -$367 | -$772 | -$82 | -$670 | -$799 | -$1,277 |
| Long Term Debt (MM) | $584 | $1,099 | $394 | $899 | $1,285 | $1,824 |
| Net Debt / EBITDA | 4.35 | 7.15 | 2.07 | 4.85 | 3.95 | 5.29 |