Now trading at a price of $113.52, Enphase Energy has moved -3.1% so far today.
Enphase Energy returned losses of -56.0% last year, with its stock price reaching a high of $339.92 and a low of $111.44. Over the same period, the stock underperformed the S&P 500 index by -70.0%. As of April 2023, the company's 50-day average price was $129.95. Enphase Energy, Inc., together with its subsidiaries, designs, develops, manufactures, and sells home energy solutions for the solar photovoltaic industry in the United States and internationally. Based in Fremont, CA, the large-cap Technology company has 2,821 full time employees. Enphase Energy has not offered a dividend during the last year.
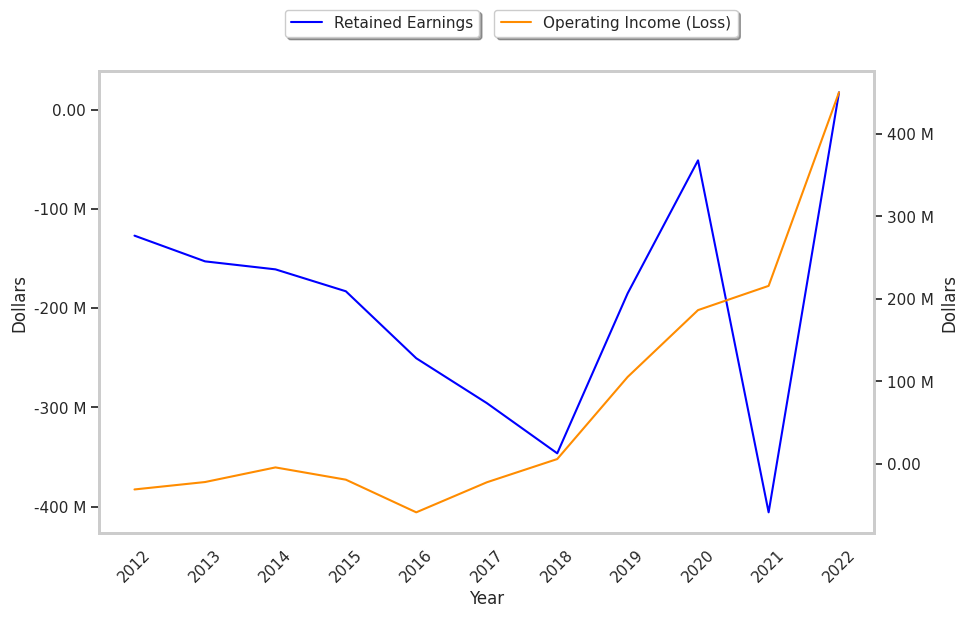
An Exceptionally Strong Balance Sheet:
| 2018-04-02 | 2019-03-15 | 2020-02-21 | 2021-02-16 | 2022-02-11 | 2023-02-13 | |
|---|---|---|---|---|---|---|
| Revenue (MM) | $286 | $316 | $624 | $774 | $1,382 | $2,331 |
| Gross Margins | 20.0% | 30.0% | 35.0% | 45.0% | 40.0% | 42.0% |
| Operating Margins | -8% | 2% | 17% | 24% | 16% | 19% |
| Net Margins | -16.0% | -4.0% | 26.0% | 17.0% | 11.0% | 17.0% |
| Net Income (MM) | -$45 | -$12 | $161 | $134 | $145 | $397 |
| Net Interest Expense (MM) | -$8 | -$10 | -$7 | -$19 | -$44 | $4 |
| Depreciation & Amort. (MM) | -$9 | -$10 | -$14 | -$18 | -$31 | -$59 |
| Earnings Per Share | -$0.54 | -$0.12 | $1.22 | $0.94 | $1.03 | $2.72 |
| EPS Growth | n/a | 77.78% | 1116.67% | -22.95% | 9.57% | 164.08% |
| Diluted Shares (MM) | 83 | 100 | 132 | 142 | 141 | 146 |
| Free Cash Flow (MM) | -$24 | $40 | $154 | $237 | $405 | $791 |
| Capital Expenditures (MM) | -$4 | -$14 | -$15 | -$21 | -$53 | -$46 |
| Net Current Assets (MM) | -$48 | -$110 | $59 | $217 | -$187 | $6 |
| Long Term Debt (MM) | $32 | $82 | $103 | $5 | $952 | $1,199 |
| Net Debt / EBITDA | -1.53 | 0.23 | -1.22 | -1.7 | 0.09 | -0.63 |
Enphase Energy has exceptional EPS growth and a pattern of improving cash flows. Additionally, the company's financial statements display an excellent current ratio and healthy leverage. However, the firm suffers from slimmer gross margins than its peers and weak operating margins with a positive growth rate. Finally, we note that Enphase Energy has weak revenue growth and a flat capital expenditure trend.
Enphase Energy's Valuation Is in Line With Its Sector Averages:
Enphase Energy has a trailing twelve month P/E ratio of 33.6, compared to an average of 27.16 for the Technology sector. Based on its EPS guidance of $6.44, the company has a forward P/E ratio of 20.2. The company doesn't provide forward earnings guidance, and the compound average growth rate of its last 6 years of reported EPS is 41.9%. On this basis, Enphase Energy's PEG ratio is 0.8. Using instead the 11.1% weighted average of Enphase Energy's earnings CAGR and the broader market's anticipated 5-year EPS growth rate, the company's PEG ratio is 3.01, which suggests that its shares may be overpriced. Furthermore, Enphase Energy is likely overvalued compared to the book value of its equity, since its P/B ratio of 15.83 is higher than the sector average of 6.23. The company's shares are currently trading 510.0% above their Graham number. Ultimately, Enphase Energy's strong cash flows, decent earnings multiple, and healthy debt levels factor towards it being fairly valued, its elevated P/B ratio notwithstanding.
Enphase Energy Has an Average Rating of Buy:
The 32 analysts following Enphase Energy have set target prices ranging from $114.0 to $335.95 per share, for an average of $192.47 with a buy rating. As of April 2023, the company is trading -32.5% away from its average target price, indicating that there is an analyst consensus of strong upside potential.
Enphase Energy has an above average percentage of its shares sold short because 11.6% of the company's shares are sold short. Institutions own 79.4% of the company's shares, and the insider ownership rate stands at 2.55%, suggesting a large amount of insider shareholders. The largest shareholder is Vanguard Group Inc, whose 12% stake in the company is worth $1,814,094,202.