Packaged Foods company Mondelez International is taking Wall Street by surprise today, falling to $65.07 and marking a -5.3% change compared to the S&P 500, which moved -0.0%. MDLZ is -21.29% below its average analyst target price of $82.67, which implies there is more upside for the stock.
As such, the average analyst rates it at buy. Over the last year, Mondelez International shares have outstripped the S&P 500 by 2.0%, with a price change of 17.0%.
Mondelez International, Inc., through its subsidiaries, manufactures, markets, and sells snack food and beverage products in the Latin America, North America, Asia, the Middle East, Africa, and Europe. The company is considered a consumer defensive, or non cyclical consumer company. The idea behind its so-called defensiveness is that its sales -- and by extension, its stock prices -- tend to remain stable during periods of economic recession.
This is because consumers tend to buy staples even when they see their discretionary income reduced. They will cut spending in other areas before they cut their spending on staples. The share prices of defensive tend to remain stable during periods of economic growth too, so their reduced volatility involves a possible trade off with respect to performance potential.
Mondelez International's trailing 12 month P/E ratio is 21.6, based on its trailing EPS of $3.01. The company has a forward P/E ratio of 18.5 according to its forward EPS of $3.52 -- which is an estimate of what its earnings will look like in the next quarter. As of the first quarter of 2023, the average Price to Earnings (P/E) ratio for US consumer staples companies is 24.36, and the S&P 500 has an average of 15.97. The P/E ratio consists in the stock's share price divided by its earnings per share (EPS), representing how much investors are willing to spend for each dollar of the company's earnings. Earnings are the company's revenues minus the cost of goods sold, overhead, and taxes.
To better understand MDLZ’s valuation, we can divide its price to earnings ratio by its projected five-year growth rate, which gives us its price to earnings, or PEG ratio. Considering the P/E ratio in the context of growth is important, because many companies that are undervalued in terms of earnings are actually overvalued in terms of growth.
Mondelez International’s PEG is 2.36, which indicates that the company is overvalued compared to its growth prospects. Bear in mind that PEG ratios have limits to their relevance, since they are based on future growth estimates that may not turn out as expected.
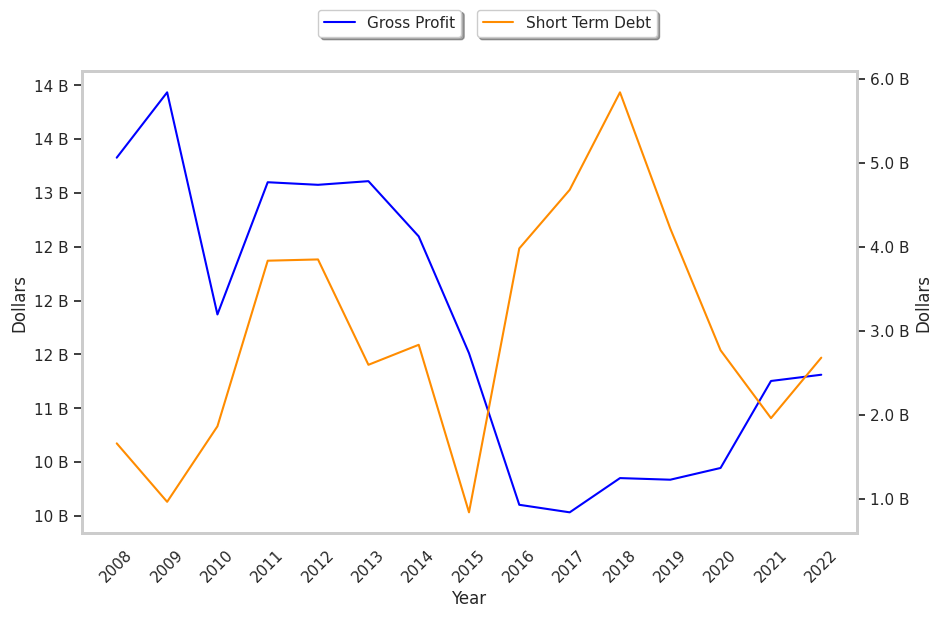
To understand a company's long term business prospects, we must consider its gross profit margins, which is the ratio of its gross profits to its revenues. A wider gross profit margin indicates that a company may have a competitive advantage, as it is free to keep its product prices high relative to their cost. After looking at its annual reports, we obtained the following information on MDLZ's margins:
| Date Reported | Revenue ($ k) | Cost of Revenue ($ k) | Gross Margins (%) | YoY Growth (%) |
|---|---|---|---|---|
| 2023-02-03 | 31,496,000 | -20,184,000 | 36 | -7.69 |
| 2022-02-04 | 28,720,000 | -17,466,000 | 39 | 0.0 |
| 2021-02-05 | 26,581,000 | -16,135,000 | 39 | -2.5 |
| 2020-02-07 | 25,868,000 | -15,531,000 | 40 | 0.0 |
| 2019-02-08 | 25,938,000 | -15,586,000 | 40 | 2.56 |
| 2018-02-09 | 25,896,000 | -15,862,000 | 39 |
- Average gross margin: 38.8 %
- Average gross margin growth rate: -0.0 %
- Coefficient of variability (higher numbers indicating more instability): 3.8 %
We can see from the above that Mondelez International's gross margins are very strong. Potential investors in the stock will want to determine what factors, if any, could derail this attractive growth story.
When we subtract capital expenditures from operating cash flows, we are left with the company's free cash flow, which for Mondelez International was $4.81 Billion as of its last annual report. The balance of cash flows represents the capital that is available for re-investment in the business, or for payouts to equity investors as dividends. The company's average cash flow over the last 4 years has been $4.62 Billion and they've been growing at an average rate of 0.0%. MDLZ's weak free cash flow trend shows that it might not be able to sustain its dividend payments, which over the last 12 months has yielded 2.2% to investors. Cutting the dividend can compound a company's problems by causing investors to sell their shares, which further pushes down its stock price.
Value investors often analyze stocks through the lens of its Price to Book (P/B) Ratio (its share price divided by its book value). The book value refers to the present value of the company if the company were to sell off all of its assets and pay all of its debts today - a number whose value may differ significantly depending on the accounting method. Mondelez international's P/B ratio indicates that the market value of the company exceeds its book value by a factor of 3.09, but is still below the average P/B ratio of the Consumer Staples sector, which stood at 4.29 as of the first quarter of 2023.
Since it has an average P/E ratio, a lower P/B ratio than its sector average, and irregular cash flows with a flat trend, Mondelez International is likely overvalued at today's prices. The company has mixed growth prospects because of an inflated PEG ratio and strong margins with a stable trend. We hope you enjoyed this overview of MDLZ's fundamentals. Be sure to check the numbers for yourself, especially focusing on their trends over the last few years.