Beverages company PepsiCo is taking Wall Street by surprise today, falling to $160.1 and marking a -5.2% change compared to the S&P 500, which moved -0.0%. PEP is -18.48% below its average analyst target price of $196.4, which implies there is more upside for the stock.
As such, the average analyst rates it at buy. Over the last year, PepsiCo has underperfomed the S&P 500 by -15.0%, moving -0.0%.
PepsiCo, Inc. manufactures, markets, distributes, and sells various beverages and convenient foods worldwide. The company is in the consumer defensive sector. It markets so-called staple goods and services that consumers tend to purchase regardless of their discretionary income. Thus, sales revenue tends to remain relatively unchecked by economic downturns, which in turn can contribute to share price stability. The flipside is that defensive stocks may see comparatively little growth during periods of economic growth.
PepsiCo's trailing 12 month P/E ratio is 28.1, based on its trailing EPS of $5.7. The company has a forward P/E ratio of 19.8 according to its forward EPS of $8.09 -- which is an estimate of what its earnings will look like in the next quarter. As of the first quarter of 2023, the average Price to Earnings (P/E) ratio for US consumer staples companies is 24.36, and the S&P 500 has an average of 15.97. The P/E ratio consists in the stock's share price divided by its earnings per share (EPS), representing how much investors are willing to spend for each dollar of the company's earnings. Earnings are the company's revenues minus the cost of goods sold, overhead, and taxes.
To better understand PEP’s valuation, we can divide its price to earnings ratio by its projected five-year growth rate, which gives us its price to earnings, or PEG ratio. Considering the P/E ratio in the context of growth is important, because many companies that are undervalued in terms of earnings are actually overvalued in terms of growth.
PepsiCo’s PEG is 2.64, which indicates that the company is overvalued compared to its growth prospects. Bear in mind that PEG ratios have limits to their relevance, since they are based on future growth estimates that may not turn out as expected.
To understand a company's long term business prospects, we must consider its gross profit margins, which is the ratio of its gross profits to its revenues. A wider gross profit margin indicates that a company may have a competitive advantage, as it is free to keep its product prices high relative to their cost. After looking at its annual reports, we obtained the following information on PEP's margins:
| Date Reported | Revenue ($ k) | Cost of Revenue ($ k) | Gross Margins (%) | YoY Growth (%) |
|---|---|---|---|---|
| 2023-02-09 | 86,392,000 | -40,576,000 | 53 | 0.0 |
| 2022-02-10 | 79,474,000 | -37,075,000 | 53 | -3.64 |
| 2021-02-11 | 70,372,000 | -31,797,000 | 55 | 0.0 |
| 2020-02-13 | 67,161,000 | -30,132,000 | 55 | 0.0 |
| 2019-02-15 | 64,661,000 | -29,381,000 | 55 | 0.0 |
| 2018-02-13 | 63,525,000 | -28,796,000 | 55 |
- Average gross margin: 54.3 %
- Average gross margin growth rate: 0.0 %
- Coefficient of variability (higher numbers indicating more instability): 1.9 %
We can see from the above that PepsiCo business is not strong and its stock is likely not suitable for conservative investors.
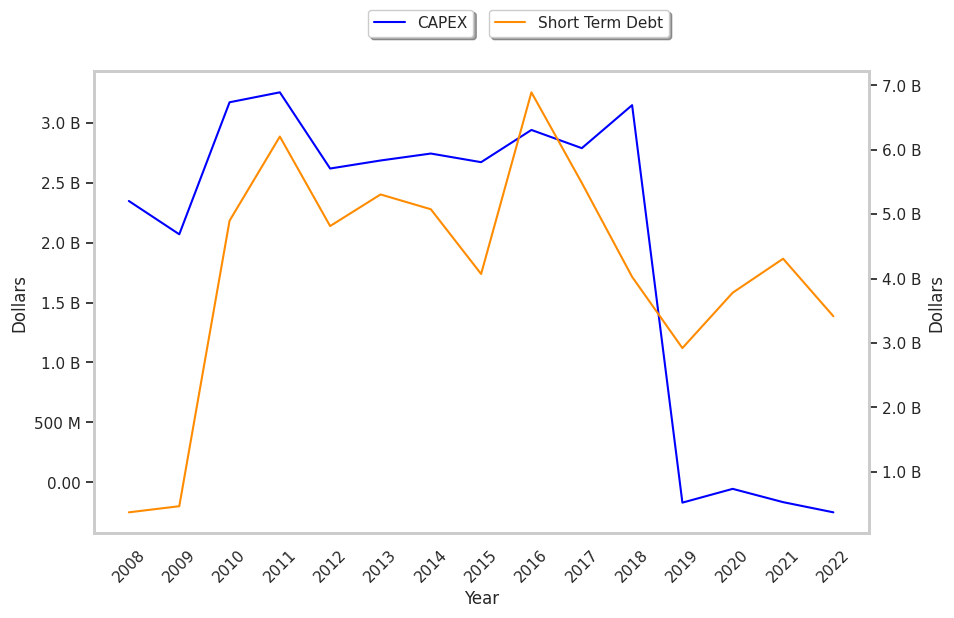
To deepen our understanding of the company's finances, we should study the effect of its depreciation and capital expenditures on the company's bottom line. We can see the effect of these additional factors in PepsiCo's free cash flow, which was $10.56 Billion as of its most recent annual report. The balance of cash flows represents the capital that is available for re-investment in the business, or for payouts to equity investors as dividends. The company's average cash flow over the last 4 years has been $11.24 Billion and they've been growing at an average rate of 0.0%. PEP's weak free cash flow trend shows that it might not be able to sustain its dividend payments, which over the last 12 months has yielded 2.8% to investors. Cutting the dividend can compound a company's problems by causing investors to sell their shares, which further pushes down its stock price.
Value investors often analyze stocks through the lens of its Price to Book (P/B) Ratio (its share price divided by its book value). The book value refers to the present value of the company if the company were to sell off all of its assets and pay all of its debts today - a number whose value may differ significantly depending on the accounting method. Pepsico's P/B ratio is 12.47 -- in other words, the market value of the company exceeds its book value by a factor of more than 12, so the company's assets may be overvalued compared to the average P/B ratio of the Consumer Staples sector, which stands at 4.29 as of the first quarter of 2023.
PepsiCo is likely overvalued at today's prices because it has an average P/E ratio, an elevated P/B ratio, and irregular cash flows with a flat trend. The stock has poor growth indicators because of its weak operating margings with a stable trend, and an inflated PEG ratio. We hope this preliminary analysis will encourage you to do your own research into PEP's fundamental values -- especially their trends over the last few years, which provide the clearest picture of the company's valuation.