Urban One logged a 0.7% change during today's morning session, and is now trading at a price of $5.08 per share.
Urban One returned losses of -10.0% last year, with its stock price reaching a high of $8.04 and a low of $4.33. Over the same period, the stock underperformed the S&P 500 index by -24.0%. As of April 2023, the company's 50-day average price was $5.37. Urban One, Inc., together with its subsidiaries, operates as an urban-oriented multi-media company in the United States. Based in Silver Spring, MD, the small-cap Consumer Discretionary company has 881 full time employees. Urban One has not offered a dividend during the last year.
The Company May Be Profitable, but Its Balance Sheet Is Highly Leveraged:
| 2017-03-10 | 2018-03-16 | 2019-03-18 | 2020-04-29 | 2021-03-31 | 2022-03-15 | |
|---|---|---|---|---|---|---|
| Revenue (k) | $456,219 | $440,041 | $439,098 | $436,929 | $376,337 | $441,462 |
| Operating Margins | 19% | 12% | 17% | 20% | 31% | 27% |
| Net Margins | 0.0% | 25.0% | 32.0% | 0.0% | -2.0% | 9.0% |
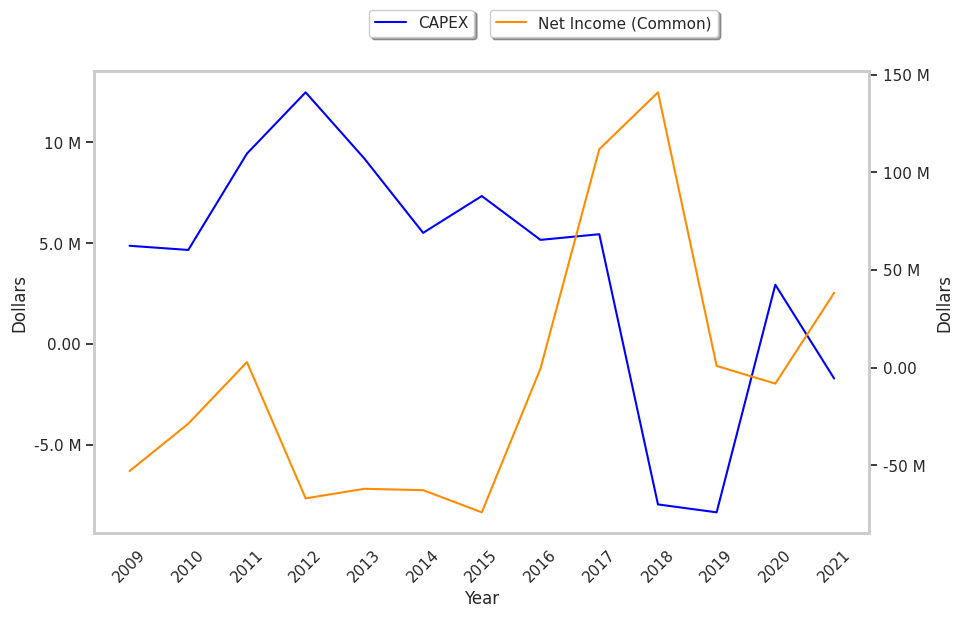
| Net Income (k) | -$423 | $111,887 | $141,001 | $925 | -$8,113 | $38,352 |
| Net Interest Expense (k) | -$81,422 | -$79,220 | -$76,427 | -$81,250 | -$74,294 | -$65,484 |
| Depreciation & Amort. (k) | -$34,247 | -$34,016 | -$33,189 | -$16,985 | -$9,741 | -$9,289 |
| Earnings Per Share | -$0.01 | $2.25 | $2.94 | $0.02 | -$0.18 | $0.7 |
| EPS Growth | n/a | 22600.0% | 30.67% | -99.32% | -1000.0% | 488.89% |
| Diluted Shares (k) | 47,925 | 49,633 | 48,001 | 47,922 | 45,041 | 55,080 |
| Free Cash Flow (k) | $53,413 | $33,752 | $42,266 | $50,150 | $76,805 | $78,436 |
| Capital Expenditures | -$5,164 | -$5,445 | $7,963 | $8,355 | -$2,938 | $1,714 |
| Net Current Assets (k) | -$1,217,842 | -$1,063,585 | -$878,837 | -$870,241 | -$772,922 | -$676,699 |
| Long Term Debt (k) | $1,002,736 | $967,166 | $873,757 | $850,308 | $818,924 | $818,616 |
Urban One has exceptional EPS growth and a pattern of improving cash flows. Additionally, the company's financial statements display an excellent current ratio and decent operating margins with a positive growth rate. However, the firm has high levels of debt. Finally, we note that Urban One has weak revenue growth and a flat capital expenditure trend.
Urban One Has Attractive Multiples and Trades Below Its Graham Number:
Urban One has a trailing twelve month P/E ratio of 7.5 compared to the Consumer Discretionary sector's average of 22.33. The company doesn't provide forward earnings guidance, and the compound average growth rate of its last 6 years of reported EPS is 104.4%. On this basis, Urban One's PEG ratio is 0.07. Using instead the 11.7% weighted average of Urban One's earnings CAGR and the broader market's anticipated 5-year EPS growth rate, the company's PEG ratio is 0.64, which implies that its shares may be underpriced. Additionally, the market is possibly undervaluing Urban One in terms of its equity because its P/B ratio is 0.73 whereas the sector average is 3.12. The company's shares are currently trading -42.4% below their Graham number.
Overview of Urban One's Market Factors:
Urban One has a very low short interest because 0.3% of the company's shares are sold short. Institutions own 40.5% of the company's shares, and the insider ownership rate stands at 11.1%, suggesting a decent amount of insider shareholders. The largest shareholder is Zazove Associates LLC, whose 6% stake in the company is worth $2,974,775.