Now trading at a price of $52.91, Cisco Systems has moved -0.3% so far today.
Cisco Systems returned gains of 32.0% last year, with its stock price reaching a high of $58.19 and a low of $38.6. Over the same period, the stock outperformed the S&P 500 index by 15.0%. More recently, the company's 50-day average price was $54.65. Cisco Systems, Inc. designs, manufactures, and sells Internet Protocol based networking and other products related to the communications and information technology industry in the Americas, Europe, the Middle East, Africa, the Asia Pacific, Japan, and China. Based in San Jose, CA, the large-cap Telecommunications company has 84,900 full time employees. Cisco Systems has offered a 2.9% dividend yield over the last 12 months.
Wider Gross Margins Than the Industry Average of 53.85%:
| 2017-09-07 | 2018-09-06 | 2019-09-05 | 2020-09-03 | 2021-09-09 | 2022-09-08 | |
|---|---|---|---|---|---|---|
| Revenue (MM) | $48,005 | $49,330 | $51,904 | $49,301 | $49,818 | $51,557 |
| Gross Margins | 63.0% | 62.0% | 63.0% | 64.0% | 64.0% | 63.0% |
| Operating Margins | 25% | 25% | 27% | 28% | 26% | 27% |
| Net Margins | 20.0% | 0.0% | 22.0% | 23.0% | 21.0% | 23.0% |
| Net Income (MM) | $9,609 | $110 | $11,621 | $11,214 | $10,591 | $11,812 |
| Net Interest Expense (MM) | $477 | $565 | $449 | $335 | $184 | $116 |
| Depreciation & Amort. (MM) | -$2,286 | -$2,192 | -$1,897 | -$1,808 | -$1,862 | -$1,957 |
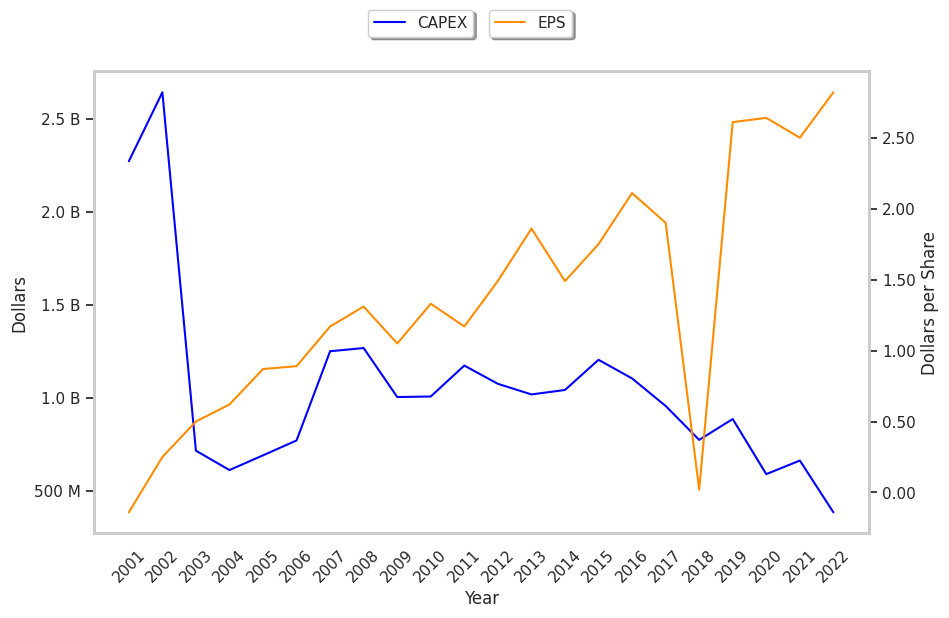
| Earnings Per Share | $1.9 | $0.02 | $2.61 | $2.64 | $2.5 | $2.82 |
| EPS Growth | n/a | -98.95% | 12950.0% | 1.15% | -5.3% | 12.8% |
| Diluted Shares (MM) | 5,049 | 4,881 | 4,453 | 4,254 | 4,236 | 4,192 |
| Free Cash Flow (MM) | $14,833 | $14,441 | $16,718 | $16,017 | $16,118 | $13,612 |
| Capital Expenditures (MM) | -$957 | -$775 | -$887 | -$591 | -$664 | -$386 |
| Net Current Assets (MM) | $20,022 | -$3,743 | -$16,467 | -$13,360 | -$17,110 | -$17,512 |
| Long Term Debt (MM) | $25,725 | $20,331 | $14,475 | $11,578 | $9,018 | $8,416 |
| Net Debt / EBITDA | -2.58 | -1.45 | -0.54 | -0.96 | -0.88 | -0.61 |
Cisco Systems has strong margins with a stable trend and low leverage. Additionally, the company's financial statements display wider gross margins than its peer group and positive EPS growth. Furthermore, Cisco Systems has weak revenue growth and a flat capital expenditure trend, irregular cash flows, and just enough current assets to cover current liabilities.
Cisco Systems's Valuation Is in Line With Its Sector Averages:
Cisco Systems has a trailing twelve month P/E ratio of 17.8, compared to an average of 18.85 for the Telecommunications sector. Based on its EPS guidance of $4.23, the company has a forward P/E ratio of 12.9. The company doesn't issue forward earnings guidance, and the compound average growth rate of its last 6 years of reported EPS is 8.3%. On this basis, the company's PEG ratio is 2.14, which suggests that it is overpriced. Furthermore, Cisco Systems is likely overvalued compared to the book value of its equity, since its P/B ratio of 4.85 is higher than the sector average of 3.12. The company's shares are currently trading 115.6% above their Graham number.
Cisco Systems Has an Average Rating of Buy:
The 20 analysts following Cisco Systems have set target prices ranging from $45.0 to $76.0 per share, for an average of $58.73 with a buy rating. As of April 2023, the company is trading -6.9% away from its average target price, indicating that there is an analyst consensus of some upside potential.
Cisco Systems has a very low short interest because 1.5% of the company's shares are sold short. Institutions own 77.4% of the company's shares, and the insider ownership rate stands at 0.08%, suggesting a small amount of insider investors. The largest shareholder is Vanguard Group Inc, whose 9% stake in the company is worth $20,311,578,849.