Now trading at a price of $25.84, Envista has moved 0.8% so far today.
Envista returned losses of -22.0% last year, with its stock price reaching a high of $43.29 and a low of $25.38. Over the same period, the stock underperformed the S&P 500 index by -40.0%. As of April 2023, the company's 50-day average price was $31.17. Envista Holdings Corporation, together with its subsidiaries, develops, manufactures, markets, and sells dental products in the United States, China, and internationally. Based in Brea, CA, the mid-cap Health Care company has 12,700 full time employees. Envista has not offered a dividend during the last year.
Shareholders Are Confronted With a Declining EPS Growth Trend:
| 2020-01-30 | 2021-02-19 | 2022-02-24 | 2023-02-16 | |
|---|---|---|---|---|
| Revenue (MM) | $2,285 | $1,929 | $2,509 | $2,569 |
| Gross Margins | 59.0% | 55.0% | 56.0% | 56.0% |
| Operating Margins | 10% | 2% | 12% | 12% |
| Net Margins | 10.0% | 2.0% | 14.0% | 9.0% |
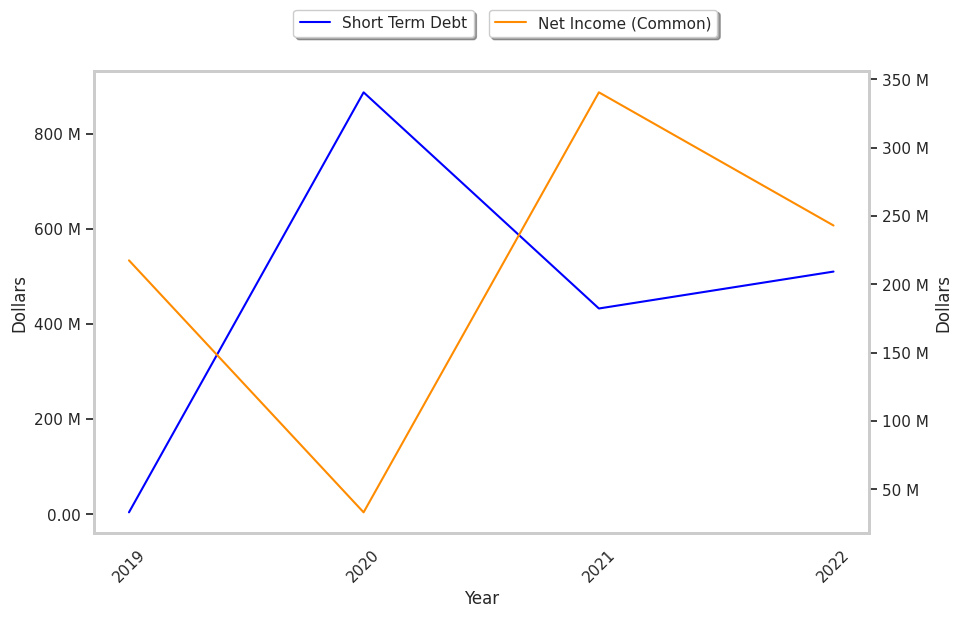
| Net Income (MM) | $218 | $33 | $340 | $243 |
| Net Interest Expense (MM) | -$4 | -$62 | -$54 | -$38 |
| Depreciation & Amort. (MM) | -$168 | -$133 | -$124 | -$138 |
| Earnings Per Share | $1.69 | $0.21 | $1.91 | $1.37 |
| EPS Growth | n/a | -87.57% | 809.52% | -28.27% |
| Diluted Shares (MM) | 129 | 159 | 178 | 178 |
| Free Cash Flow (MM) | $474 | $326 | $405 | $255 |
| Capital Expenditures (MM) | -$76 | -$42 | -$43 | -$72 |
| Net Current Assets (MM) | -$1,614 | -$1,564 | -$680 | -$956 |
| Long Term Debt (MM) | $1,321 | $908 | $883 | $871 |
| Net Debt / EBITDA | 2.76 | 5.14 | 0.56 | 1.69 |
Envista has slimmer gross margins than its peers, weak operating margins with a positive growth rate, and declining EPS growth. On the other hand, the company has healthy leverage working in its favor. Furthermore, Envista has weak revenue growth and a flat capital expenditure trend, irregular cash flows, and just enough current assets to cover current liabilities.
Envista Is Reasonably Priced:
Envista has a trailing twelve month P/E ratio of 25.8, compared to an average of 24.45 for the Health Care sector. Based on its EPS guidance of $2.09, the company has a forward P/E ratio of 14.9. The company doesn't issue forward earnings guidance, and the compound average growth rate of its last 4 years of reported EPS is -8.0%. On this basis, the company's PEG ratio is -3.21, which indicates that its shares are overpriced. In contrast, the market is likely undervaluing Envista in terms of its equity because its P/B ratio is 0.98 while the sector average is 4.16. The company's shares are currently trading -4.4% below their Graham number.
Envista Has an Average Rating of Buy:
The 9 analysts following Envista have set target prices ranging from $33.0 to $46.0 per share, for an average of $42.22 with a buy rating. As of April 2023, the company is trading -26.2% away from its average target price, indicating that there is an analyst consensus of strong upside potential.
Envista has an average amount of shares sold short because 4.0% of the company's shares are sold short. Institutions own 115.8% of the company's shares, and the insider ownership rate stands at 0.36%, suggesting a small amount of insider investors. The largest shareholder is Blackrock Inc., whose 11% stake in the company is worth $453,003,704.