Today we're going to take a closer look at large-cap Energy company Schlumberger, whose shares are currently trading at $55.76. We've been asking ourselves whether the company is under or over valued at today's prices... let's perform a brief value analysis to find out!
The Market May Be Overvaluing Schlumberger's Earnings and Assets:
Schlumberger Limited engages in the provision of technology for the energy industry worldwide. The company operates through four divisions: Digital & Integration, Reservoir Performance, Well Construction, and Production Systems. The company provides field development and hydrocarbon production, carbon management, integration of adjacent energy systems; reservoir interpretation and data processing services for exploration data; and well construction and production improvement services and products. The company belongs to the Energy sector, which has an average price to earnings (P/E) ratio of 7.54 and an average price to book (P/B) ratio of 1.68. In contrast, Schlumberger has a trailing 12 month P/E ratio of 20.4 and a P/B ratio of 4.26.
When we divideSchlumberger's P/E ratio by its expected five-year EPS growth rate, we obtain a PEG ratio of 0.57, which indicates that the market is undervaluing the company's projected growth (a PEG ratio of 1 indicates a fairly valued company). Your analysis of the stock shouldn't end here. Rather, a good PEG ratio should alert you that it may be worthwhile to take a closer look at the stock.
Wider Gross Margins Than the Industry Average of 11.83%:
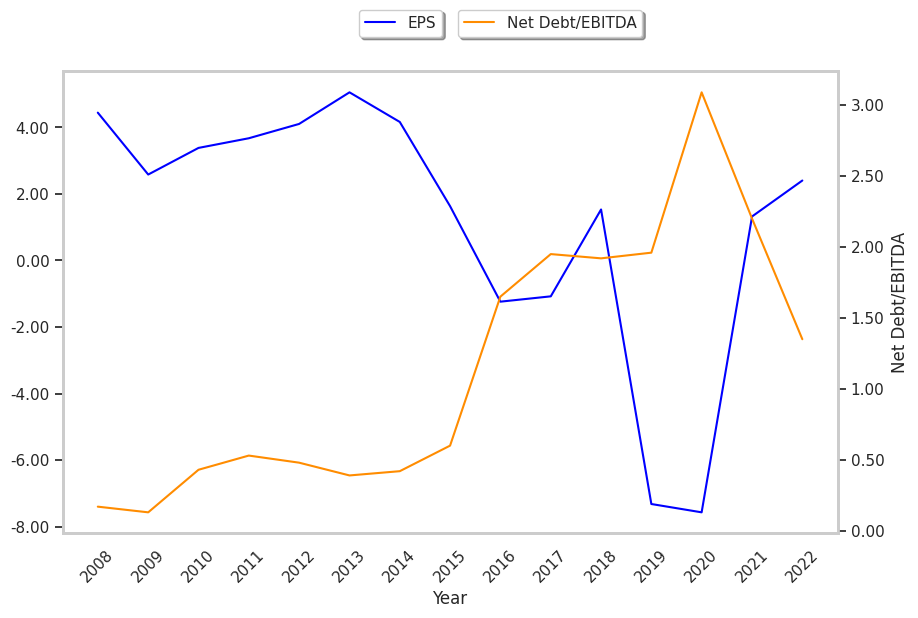
| 2018-01-24 | 2019-01-23 | 2020-01-22 | 2021-01-27 | 2022-01-26 | 2023-01-25 | |
|---|---|---|---|---|---|---|
| Revenue (MM) | $30,440 | $32,815 | $32,917 | $23,601 | $22,929 | $28,091 |
| Gross Margins | 13.0% | 13.0% | 13.0% | 11.0% | 16.0% | 18.0% |
| Operating Margins | 10% | 10% | 9% | 8% | 13% | 17% |
| Net Margins | -5.0% | 7.0% | -31.0% | -45.0% | 8.0% | 12.0% |
| Net Income (MM) | -$1,505 | $2,138 | -$10,137 | -$10,518 | $1,881 | $3,441 |
| Net Interest Expense (MM) | -$566 | -$575 | -$609 | -$563 | -$539 | -$490 |
| Depreciation & Amort. (MM) | -$3,837 | -$3,556 | -$3,589 | -$2,566 | -$2,120 | -$2,147 |
| Earnings Per Share | -$1.08 | $1.53 | -$7.32 | -$7.57 | $1.32 | $2.4 |
| EPS Growth | n/a | 241.67% | -578.43% | -3.42% | 117.44% | 81.82% |
| Diluted Shares (MM) | 1,388 | 1,393 | 1,385 | 1,390 | 1,427 | 1,436 |
| Free Cash Flow (MM) | $7,770 | $7,873 | $7,155 | $4,060 | $5,792 | $4,995 |
| Capital Expenditures (MM) | -$2,107 | -$2,160 | -$1,724 | -$1,116 | -$1,141 | -$1,275 |
| Net Current Assets (MM) | -$16,229 | -$18,190 | -$16,606 | -$17,026 | -$13,571 | -$10,143 |
| Long Term Debt (MM) | $14,875 | $14,644 | $14,770 | $16,036 | $13,286 | $10,594 |
| Net Debt / EBITDA | 1.95 | 1.92 | 1.96 | 3.09 | 2.2 | 1.35 |
Schlumberger has strong margins with a positive growth rate and wider gross margins than its peer group. Additionally, the company's financial statements display a strong EPS growth trend and healthy leverage. Furthermore, Schlumberger has weak revenue growth and a flat capital expenditure trend, irregular cash flows, and just enough current assets to cover current liabilities.