Southern Company does not have the profile of a defensive investment based on the requirements of Ben Graham. The Utilities—Independent Power Producers firm may nonetheless be of interest to more risk-oriented investors who have a solid thesis on the company's future growth. At Market Inference, we remain agnostic as to such further developments, and prefer to use a company's past track record as the bellwether for future potential gains.
Southern Company Is Probably Overvalued
Graham devised the below equation to give investors a quick way of determining whether a stock is trading at a fair multiple of its earnings and its assets:
√(22.5 * 6 year average earnings per share (2.67) * 6 year average book value per share (28.125) = $49.28
At today's price of $64.92 per share, Southern Company is now trading 31.7% above the maximum price that Graham would have wanted to pay for the stock.
Even though the stock does not trade at an attractive multiple, it might still meet some of the other criteria for quality stocks that Graham listed in Chapter 14 of The Intelligent Investor.
Positive Retained Earnings From 2008 To 2022, A Solid Record Of Dividends, and Some Eps Growth
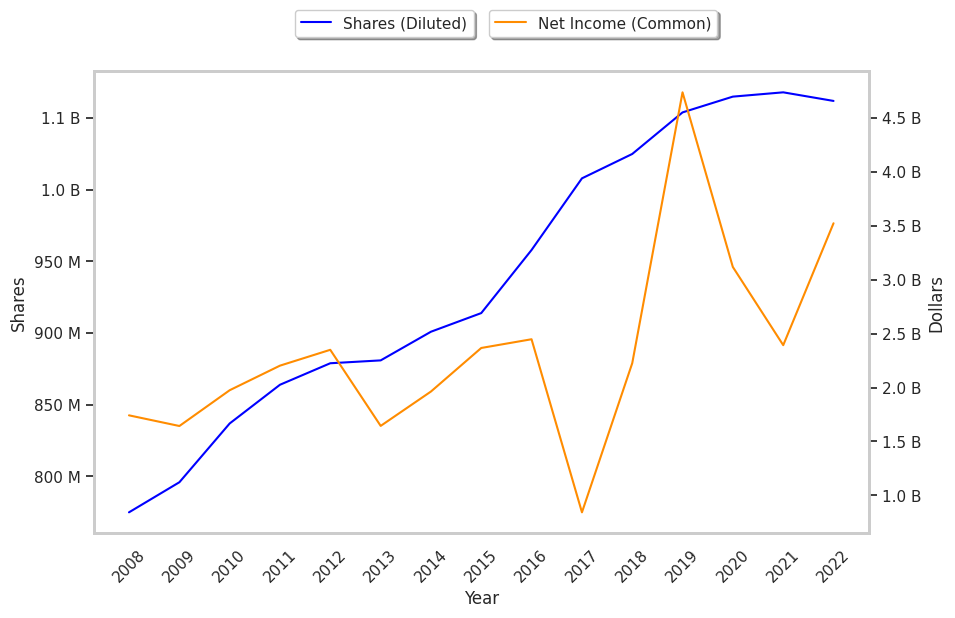
Ben Graham wrote that an investment in a company with a record of positive retained earnings could contribute significantly to the margin of safety. Southern Company had positive retained earnings from 2008 to 2022 with an average of $9.61 Billion over this period.
Another one of Graham's requirements is for a 30% or more cumulative growth rate of the company's earnings per share over the last ten years.Southern Company's earnings per share growth will be calculated using the average EPS of the years 2007, 2008, and 2009, and the average of the years 2020, 2021, and 2022. For the years starting in 2007, we have EPS values of $2.28, $2.25, and $2.06, which give us an average of $2.20. From 2020 to the present, we have EPS values of $2.93, $2.24, and $3.26, which average out to $2.81. The growth rate between the two averages is 27.73%, which falls short of Graham's 30% requirement while remaining positive.
Southern Company has offered a regular dividend since at least 2007. The company has returned an average dividend yield of 4.2% over the last five years.
Negative Current Asset to Liabilities Balance and Not Enough Current Assets to Cover Current Liabilities
Graham sought companies with extremely low debt levels compared to their assets. For one, he expected their current ratio to be over 2 and their long term debt to net current asset ratio to be near, or ideally under, under 1. Southern Company fails on both counts with a current ratio of 0.7 and a debt to net current asset ratio of -0.6.
Conclusion
According to Graham's analysis, Southern Company is likely a company of average quality, which does not offer a significant enough margin of safety for a risk averse investor.
| 2018-02-21 | 2019-02-20 | 2020-02-20 | 2021-02-18 | 2022-02-17 | 2023-02-16 | |
|---|---|---|---|---|---|---|
| Revenue (MM) | $23,031 | $23,495 | $21,419 | $20,375 | $23,113 | $29,279 |
| Gross Margins | 68.0% | 66.0% | 71.0% | 75.0% | 70.0% | 60.0% |
| Operating Margins | 26% | 22% | 25% | 25% | 23% | 20% |
| Net Margins | 4.0% | 10.0% | 22.0% | 15.0% | 10.0% | 12.0% |
| Net Income (MM) | $880 | $2,242 | $4,754 | $3,134 | $2,408 | $3,535 |
| Net Interest Expense (MM) | -$1,694 | -$1,842 | -$1,736 | -$1,821 | -$1,837 | -$2,022 |
| Depreciation & Amort. (MM) | -$3,457 | -$3,549 | -$3,331 | -$3,905 | -$3,973 | -$4,064 |
| Earnings Per Share | $0.84 | $2.17 | $4.5 | $2.93 | $2.24 | $3.32 |
| EPS Growth | n/a | 158.33% | 107.37% | -34.89% | -23.55% | 48.21% |
| Diluted Shares (MM) | 1,008 | 1,025 | 1,054 | 1,065 | 1,068 | 1,062 |
| Free Cash Flow (MM) | $13,818 | $14,946 | $8,214 | $13,169 | $12,838 | $13,950 |
| Capital Expenditures (MM) | -$7,423 | -$8,001 | -$2,433 | -$6,473 | -$6,669 | -$7,648 |
| Net Current Assets (MM) | -$75,081 | -$78,748 | -$76,833 | -$81,793 | -$86,002 | -$89,943 |
| Long Term Debt (MM) | $44,462 | $40,736 | $41,798 | $45,073 | $50,120 | $50,656 |
| Net Debt / EBITDA | 5.19 | 5.21 | 5.18 | 5.32 | 5.66 | 5.67 |