Advance Auto Parts may be undervalued with mixed growth prospects, but the 18 analysts following the company give it an rating of hold. Their target prices range from $42.0 to $98.0 per share, for an average of $69.5. At today's price of $52.17, Advance Auto Parts is trading -24.93% away from its average target price, suggesting there is an analyst consensus of strong upside potential for the stock.
Advance Auto Parts, Inc. provides automotive replacement parts, accessories, batteries, and maintenance items for domestic and imported cars, vans, sport utility vehicles, and light and heavy duty trucks. Based in Raleigh, NC, the large-cap Consumer Discretionary company has 40,000 full time employees. Advance Auto Parts has provided a 9.2% dividend yield over the last 12 months.
Advance Auto Parts has a trailing twelve month P/E ratio of 9.1, compared to an average of 22.33 for the Consumer Discretionary sector. Considering its EPS guidance of $5.49, the company has a forward P/E ratio of 9.5.
The average compound growth rate of the company's last 6 years of reported earnings per share is -1.9% (the company doesn't issue forward EPS guidance). On this basis, the company's PEG ratio is -5.85, which indicates that its shares are overpriced.
On the other hand, the market is potentially undervaluing Advance Auto Parts in terms of its book value because its P/B ratio is 1.13. In comparison, the sector average P/B ratio is 3.12. The company's shares are currently -39.9% below their Graham number, indicating that its shares have a margin of safety.
| 2018-02-21 | 2019-02-19 | 2020-02-18 | 2021-02-22 | 2022-02-15 | 2023-02-28 | |
|---|---|---|---|---|---|---|
| Revenue (MM) | $9,374 | $9,581 | $9,709 | $10,106 | $10,998 | $11,155 |
| Gross Margins | 44.0% | 44.0% | 44.0% | 44.0% | 45.0% | 44.0% |
| Operating Margins | 6% | 6% | 7% | 7% | 8% | 6% |
| Net Margins | 5.0% | 4.0% | 5.0% | 5.0% | 6.0% | 4.0% |
| Net Income (MM) | $476 | $424 | $487 | $493 | $616 | $502 |
| Net Interest Expense (MM) | -$59 | -$57 | -$40 | -$47 | -$38 | -$51 |
| Depreciation & Amort. (MM) | -$249 | -$238 | -$238 | -$250 | -$260 | -$284 |
| Earnings Per Share | $6.42 | $5.73 | $6.84 | $7.14 | $9.73 | $7.92 |
| EPS Growth | n/a | -10.75% | 19.37% | 4.39% | 36.27% | -18.6% |
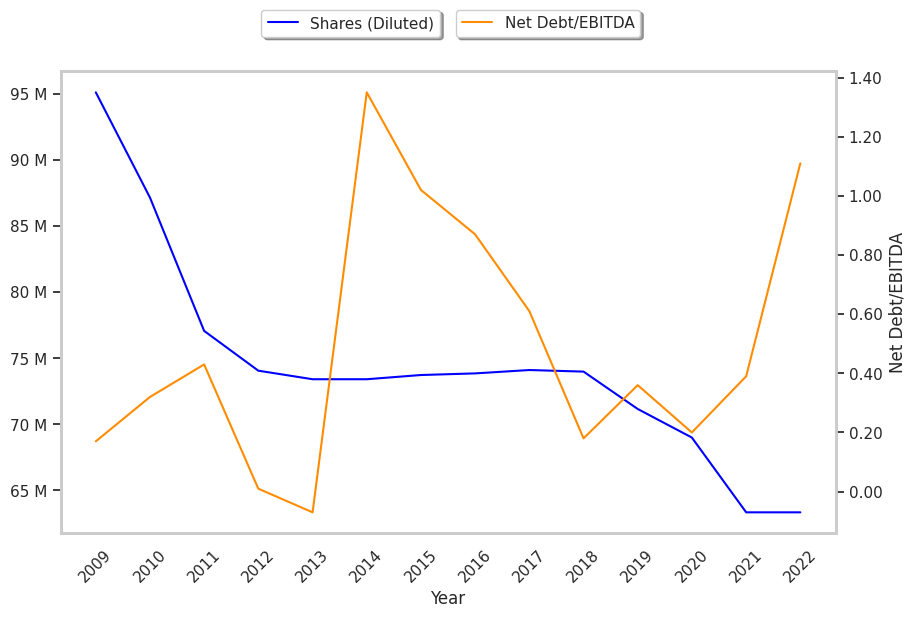
| Diluted Shares (MM) | 74 | 74 | 71 | 69 | 63 | 63 |
| Free Cash Flow (MM) | $779 | $1,003 | $1,330 | $1,237 | $1,400 | $1,147 |
| Capital Expenditures (MM) | -$179 | -$192 | -$463 | -$267 | -$287 | -$424 |
| Net Current Assets (MM) | $360 | $593 | -$2,004 | -$2,010 | -$2,790 | -$3,293 |
| Long Term Debt (MM) | $1,044 | $1,046 | $747 | $1,033 | $1,034 | $1,188 |
| Net Debt / EBITDA | 0.61 | 0.18 | 0.36 | 0.2 | 0.39 | 1.11 |