A strong performer from today's morning trading session is Morgan Stanley, whose shares rose 1.1% to $80.81 per share. For those of you thinking about investing in the stock, here is a brief value analysis of the stock using the company's basic fundamental ratios.
Morgan Stanley Is Fairly Valued:
Morgan Stanley, a financial holding company, provides various financial products and services to corporations, governments, financial institutions, and individuals in the Americas, Europe, the Middle East, Africa, and Asia. The company belongs to the Finance sector, which has an average price to earnings (P/E) ratio of 14.34 and an average price to book (P/B) ratio of 1.57. In contrast, Morgan Stanley has a trailing 12 month P/E ratio of 14.2 and a P/B ratio of 1.46.
Morgan Stanley's PEG ratio is 2.83, which shows that the stock is probably overvalued in terms of its estimated growth. For reference, a PEG ratio near or below 1 is a potential signal that a company is undervalued.
The Business Has Operating Margins Consistently Higher Than the 0.41% industry Average:
| 2017-02-27 | 2018-02-27 | 2019-02-26 | 2020-02-27 | 2021-02-26 | 2022-02-24 | |
|---|---|---|---|---|---|---|
| Revenue (MM) | $34,631 | $37,945 | $40,107 | $41,538 | $48,757 | $59,755 |
| Operating Margins | 26% | 27% | 28% | 27% | 30% | 33% |
| Net Margins | 17% | 16% | 22% | 22% | 23% | 25% |
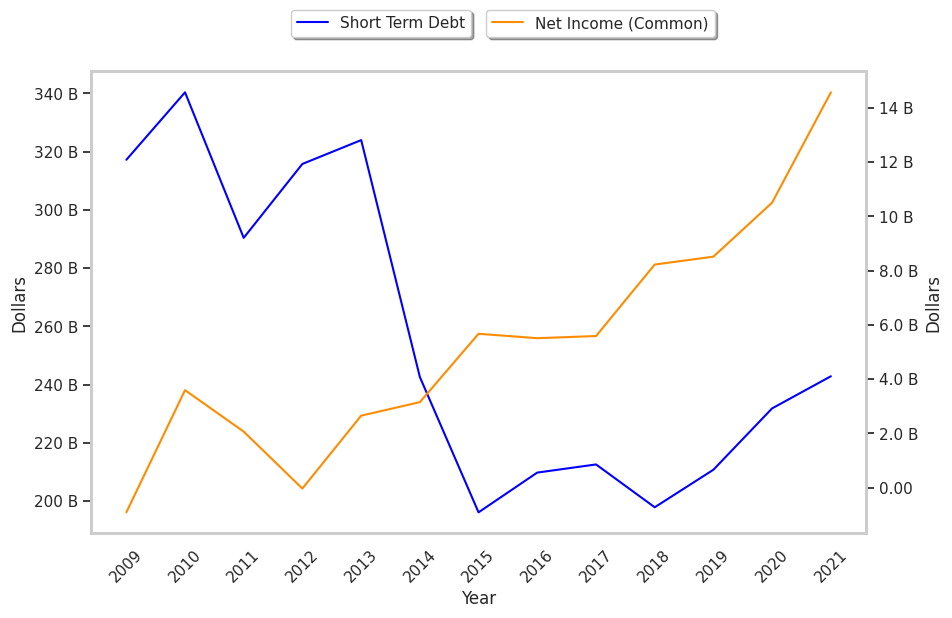
| Net Income (MM) | $5,979 | $6,111 | $8,748 | $9,042 | $10,996 | $15,034 |
| Earnings Per Share | $2.92 | $3.07 | $4.73 | $5.19 | $6.47 | $8.16 |
| EPS Growth | n/a | 5.14% | 54.07% | 9.73% | 24.66% | 26.12% |
| Diluted Shares (MM) | 1,887 | 1,821 | 1,738 | 1,640 | 1,624 | 1,785 |
| Free Cash Flow (MM) | $6,659 | -$2,876 | $9,170 | $42,599 | -$23,787 | $36,279 |
| Capital Expenditures (MM) | -$1,276 | -$1,629 | -$1,865 | -$1,826 | -$1,444 | -$2,308 |
| Long Term Debt (MM) | $165,716 | $192,582 | $189,662 | $192,627 | $217,079 | $233,127 |
Morgan Stanley has weak revenue growth and a flat capital expenditure trend, irregular cash flows, and an average amount of debt. We also note that the company benefits from strong margins with a stable trend and a strong EPS growth trend. Furthermore, Morgan Stanley's financial statements do not display any obvious red flags.