Today we're going to take a closer look at large-cap Technology company Micron Technology, whose shares are currently trading at $69.02. We've been asking ourselves whether the company is under or over valued at today's prices... let's perform a brief value analysis to find out!
Trades Below Its Graham Number but Has an Elevated P/E Ratio:
Micron Technology, Inc. designs, develops, manufactures, and sells memory and storage products worldwide. The company belongs to the Technology sector, which has an average price to earnings (P/E) ratio of 27.16 and an average price to book (P/B) ratio of 6.23. In contrast, Micron Technology has a trailing 12 month P/E ratio of -12.9 and a P/B ratio of 1.72.
Micron Technology's PEG ratio is 16.27, which shows that the stock is probably overvalued in terms of its estimated growth. For reference, a PEG ratio near or below 1 is a potential signal that a company is undervalued.
The Company Has a Positive Net Current Asset Value:
| 2017-10-26 | 2018-10-15 | 2019-10-17 | 2020-10-19 | 2021-10-08 | 2022-10-07 | |
|---|---|---|---|---|---|---|
| Revenue (MM) | $20,322 | $30,391 | $23,406 | $21,435 | $27,705 | $30,758 |
| Gross Margins | 42.0% | 59.0% | 46.0% | 31.0% | 38.0% | 45.0% |
| Operating Margins | 28% | 49% | 32% | 14% | 23% | 32% |
| Net Margins | 25.0% | 47.0% | 27.0% | 13.0% | 21.0% | 28.0% |
| Net Income (MM) | $5,089 | $14,135 | $6,313 | $2,687 | $5,861 | $8,687 |
| Net Interest Expense (MM) | -$560 | -$222 | $77 | -$80 | -$146 | -$93 |
| Depreciation & Amort. (MM) | -$3,861 | -$4,759 | -$5,424 | -$5,650 | -$6,214 | -$7,116 |
| Earnings Per Share | $4.41 | $11.5 | $5.52 | $2.38 | $5.14 | $7.74 |
| EPS Growth | n/a | 160.77% | -52.0% | -56.88% | 115.97% | 50.58% |
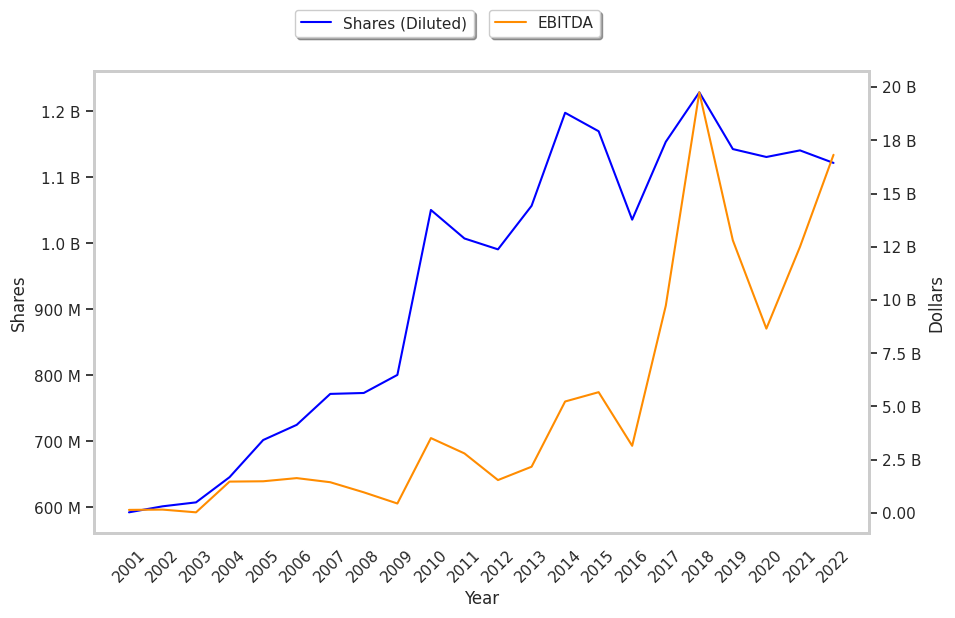
| Diluted Shares (MM) | 1,154 | 1,229 | 1,143 | 1,131 | 1,141 | 1,122 |
| Free Cash Flow (MM) | $12,887 | $26,279 | $22,969 | $16,529 | $22,498 | $26,360 |
| Capital Expenditures (MM) | -$4,734 | -$8,879 | -$9,780 | -$8,223 | -$10,030 | -$11,179 |
| Net Current Assets (MM) | -$3,409 | $5,924 | $4,484 | $3,283 | $4,991 | $5,405 |
| Long Term Debt (MM) | $9,893 | $3,780 | $4,541 | $6,373 | $6,621 | $6,803 |
| Net Debt / EBITDA | 0.59 | -0.11 | -0.16 | -0.17 | -0.15 | -0.14 |
Micron Technology has weak revenue growth and a flat capital expenditure trend, average net margins with a stable trend, and irregular cash flows. We also note that the company benefits from an excellent current ratio and low leverage. However, the firm suffers from slimmer gross margins than its peers and declining EPS growth.