It hasn't been a great afternoon session for Dollar General investors, who have watched their shares sink by -2.1% to a price of $103.17. Some of you might be wondering if it's time to buy the dip. If you are considering this, make sure to check the company's fundamentals first to determine if the shares are fairly valued at today's prices.
A Very Low P/E Ratio but Trades Above Its Graham Number:
Dollar General Corporation, a discount retailer, provides various merchandise products in the southern, southwestern, midwestern, and eastern United States. The company belongs to the Consumer Discretionary sector, which has an average price to earnings (P/E) ratio of 22.33 and an average price to book (P/B) ratio of 3.12. In contrast, Dollar General has a trailing 12 month P/E ratio of 10.6 and a P/B ratio of 3.6.
When we divide Dollar General's P/E ratio by its expected EPS growth rate of the next five years, we obtain its PEG ratio of -29.0. Since it's negative, the company has negative growth expectations, and most investors will probably avoid the stock unless it has an exceptionally low P/E and P/B ratio.
Wider Gross Margins Than the Industry Average of 23.25%:
| 2017-03-24 | 2018-03-23 | 2019-03-22 | 2020-03-19 | 2021-03-19 | 2022-03-18 | |
|---|---|---|---|---|---|---|
| Revenue (MM) | $21,987 | $23,471 | $25,625 | $27,754 | $33,747 | $34,220 |
| Gross Margins | 31.0% | 31.0% | 30.0% | 31.0% | 32.0% | 32.0% |
| Operating Margins | 9% | 9% | 8% | 8% | 11% | 9% |
| Net Margins | 6.0% | 7.0% | 6.0% | 6.0% | 8.0% | 7.0% |
| Net Income (MM) | $1,251 | $1,539 | $1,589 | $1,713 | $2,655 | $2,399 |
| Net Interest Expense (MM) | -$98 | -$97 | -$100 | -$101 | -$150 | -$158 |
| Depreciation & Amort. (MM) | -$380 | -$404 | -$454 | -$505 | -$574 | -$641 |
| Earnings Per Share | $4.43 | $5.63 | $5.97 | $6.64 | $10.62 | $10.45 |
| EPS Growth | n/a | 27.09% | 6.04% | 11.22% | 59.94% | -1.6% |
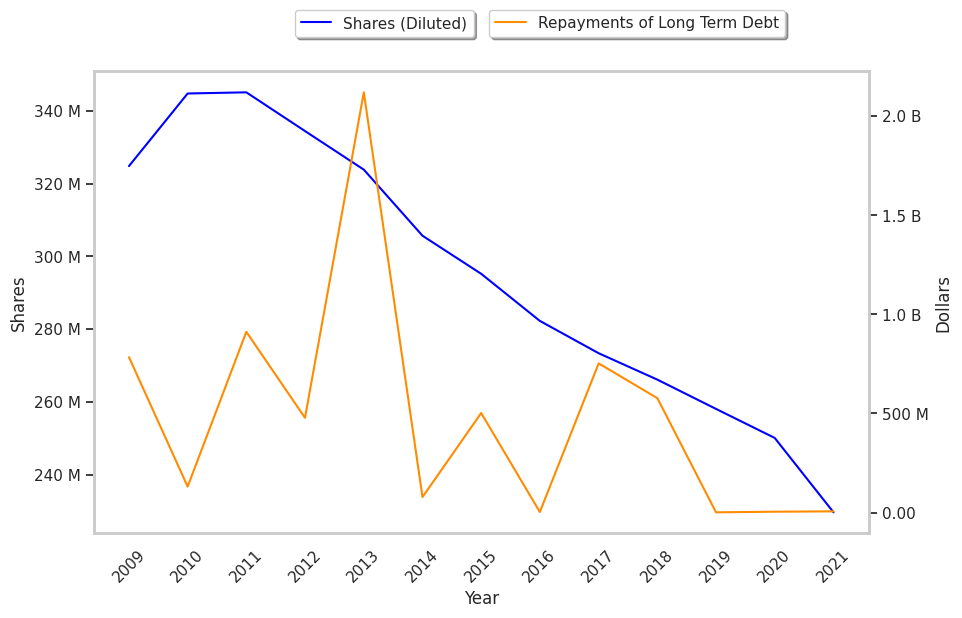
| Diluted Shares (MM) | 282 | 273 | 266 | 258 | 250 | 230 |
| Free Cash Flow (MM) | $2,156 | $2,447 | $2,875 | $3,020 | $4,901 | $3,931 |
| Capital Expenditures (MM) | -$551 | -$645 | -$732 | -$782 | -$1,025 | -$1,066 |
| Net Current Assets (MM) | -$2,588 | -$2,143 | -$2,124 | -$10,945 | -$12,287 | -$13,762 |
| Long Term Debt (MM) | $2,711 | $2,605 | $2,863 | $2,912 | $4,131 | $4,172 |
Dollar General has strong margins with a stable trend and healthy debt levels. Additionally, the company's financial statements display wider gross margins than its peer group and a strong EPS growth trend. Furthermore, Dollar General has weak revenue growth and a flat capital expenditure trend and irregular cash flows.