Invesco may be undervalued with poor growth indicators, but the 12 analysts following the company give it an rating of hold. Their target prices range from $15.0 to $21.0 per share, for an average of $16.9. At today's price of $13.82, Invesco is trading -18.2% away from its average target price, suggesting there is an analyst consensus of some upside potential for the stock.
Invesco Ltd. is a publicly owned investment manager. Based in Atlanta, GA, the mid-cap Finance company has 8,621 full time employees. Invesco has provided a 5.6% dividend yield over the last 12 months.
Invesco has a trailing twelve month P/E ratio of 9.9, compared to an average of 14.34 for the Finance sector. Considering its EPS guidance of $1.82, the company has a forward P/E ratio of 7.6.
The average compound growth rate of the company's last 6 years of reported earnings per share is -10.6% (the company doesn't issue forward EPS guidance). On this basis, the company's PEG ratio is -1.02, which indicates that its shares are overpriced.
On the other hand, the market is potentially undervaluing Invesco in terms of its book value because its P/B ratio is 0.55. In comparison, the sector average P/B ratio is 1.57. The company's shares are currently -60.0% below their Graham number, indicating that its shares have a margin of safety.
So why does Invesco get a bad rating from most analysts despite its seemingly attractive valuation? One reason could be its worrying EPS growth rate of -10.6%.
| 2018-02-23 | 2019-02-22 | 2020-03-02 | 2021-02-19 | 2022-02-18 | 2023-02-23 | |
|---|---|---|---|---|---|---|
| Revenue (MM) | $5,160 | $5,314 | $6,117 | $6,146 | $6,894 | $6,049 |
| Interest Income (MM) | -$81 | -$90 | -$107 | -$109 | -$70 | -$61 |
| Operating Margins | 27% | 25% | 23% | 20% | 25% | 22% |
| Net Margins | 22.0% | 17.0% | 11.0% | 12.0% | 24.0% | 15.0% |
| Net Income (MM) | $1,127 | $883 | $688 | $762 | $1,630 | $921 |
| Depreciation & Amort. (MM) | -$117 | -$142 | -$178 | -$204 | -$205 | -$195 |
| Earnings Per Share | $2.75 | $2.14 | $1.28 | $1.13 | $2.99 | $1.47 |
| EPS Growth | n/a | -22.18% | -40.19% | -11.72% | 164.6% | -50.84% |
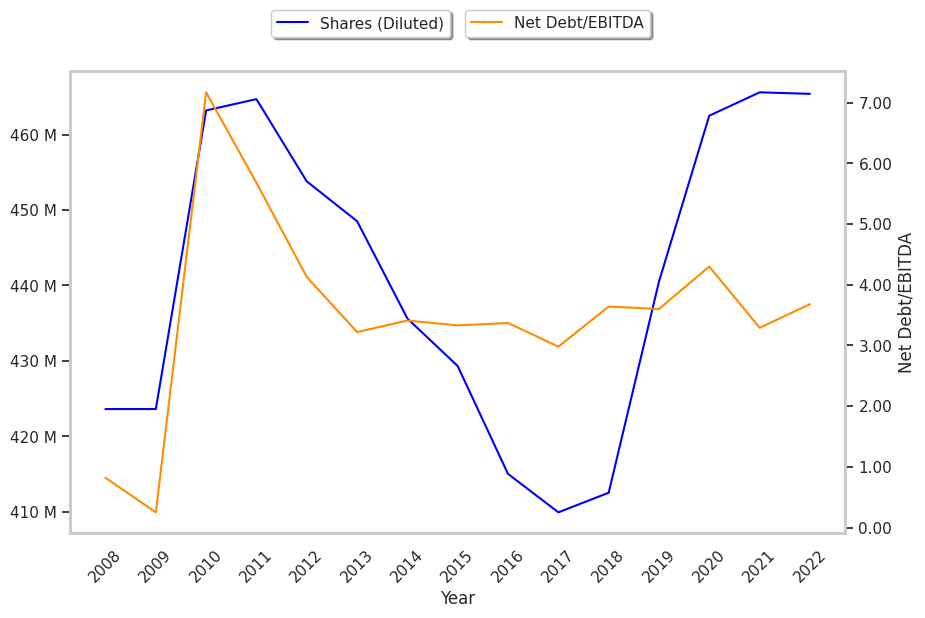
| Diluted Shares (MM) | 410 | 412 | 440 | 462 | 466 | 465 |
| Free Cash Flow (MM) | $1,270 | $931 | $1,241 | $1,345 | $1,187 | $896 |
| Capital Expenditures (MM) | -$112 | -$102 | -$124 | -$115 | -$109 | -$193 |
| Net Current Assets (MM) | -$5,285 | -$6,936 | -$10,017 | -$10,189 | -$11,616 | -$9,478 |
| Long Term Debt (MM) | $2,860 | $2,588 | $8,315 | $2,083 | $9,421 | $8,078 |